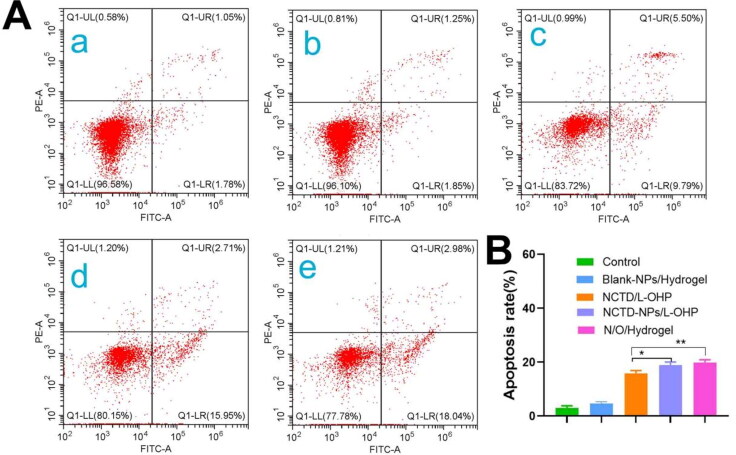
Figure 4.
Cell apoptosis analysis. (A) Flow cytometric analysis of the effect of different drugs on apoptosis of H22 cells. a: Control, b: Blank-NPs/Hydrogel, c: NCTD/L-OHP, d: N/O/Hydrogel. (B) Flow cytometry analysis of apoptosis rates of H22 cells induced by different preparation groups. Results are mean ± SD of three replicates (ns: no statistical significance, *P < 0.05, **P < 0.01, ***P < 0.001, ****P < 0.0001).

