Figure 5.
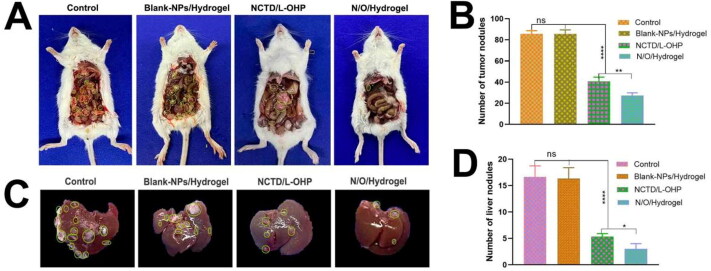
The evaluation of antitumor effects of different drug treatments in Kunming white mice. (Mean ± SD; n = 3). (A) The abdominal cavity photography of mice in each group. (B) The number of tumor nodules in the abdominal cavity of mice in different treatment groups was recorded. (C) The liver photography of mice in each group. (D) The number of tumor nodules on the liver surface of mice in different treatment groups was recorded. (ns: no statistical significance, *P < 0.05, **P < 0.01, ***P < 0.001, ****P < 0.0001).

