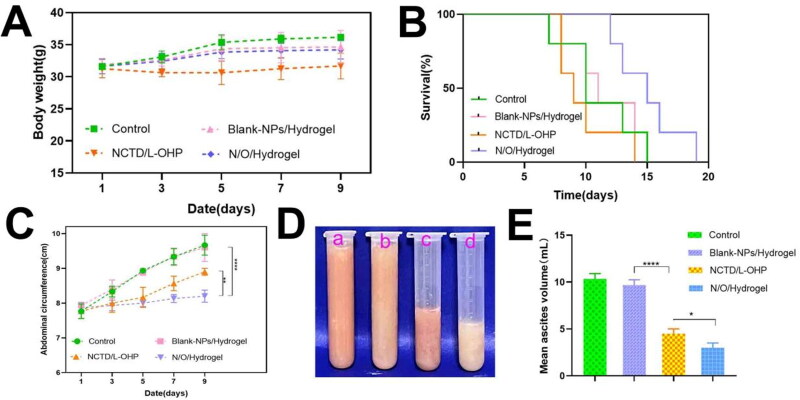
Figure 6.
The evaluation of antitumor effects of different drug treatments in Kunming white mice. (A) The weight changes of mice in different drug treatment groups from the beginning of treatment to the 9th day of observation. (B) The difference of survival time of mice treated with different drugs. (n = 5). (C) Abdominal circumference changes of mice treated with different drugs were recorded every two days from the beginning of treatment to the 9th day of observation. (D and E) The ascites collected from the abdominal cavity of mice in different treatment groups were photographed and measured. a: Control, b: Blank-NPs/Hydrogel, c: NCTD/L-OHP, d: N/O/Hydrogel. Results are mean ± SD of three replicates (ns: no statistical significance, *P < 0.05, **P < 0.01, ***P < 0.001, ****P < 0.0001).

