
Fig 11:
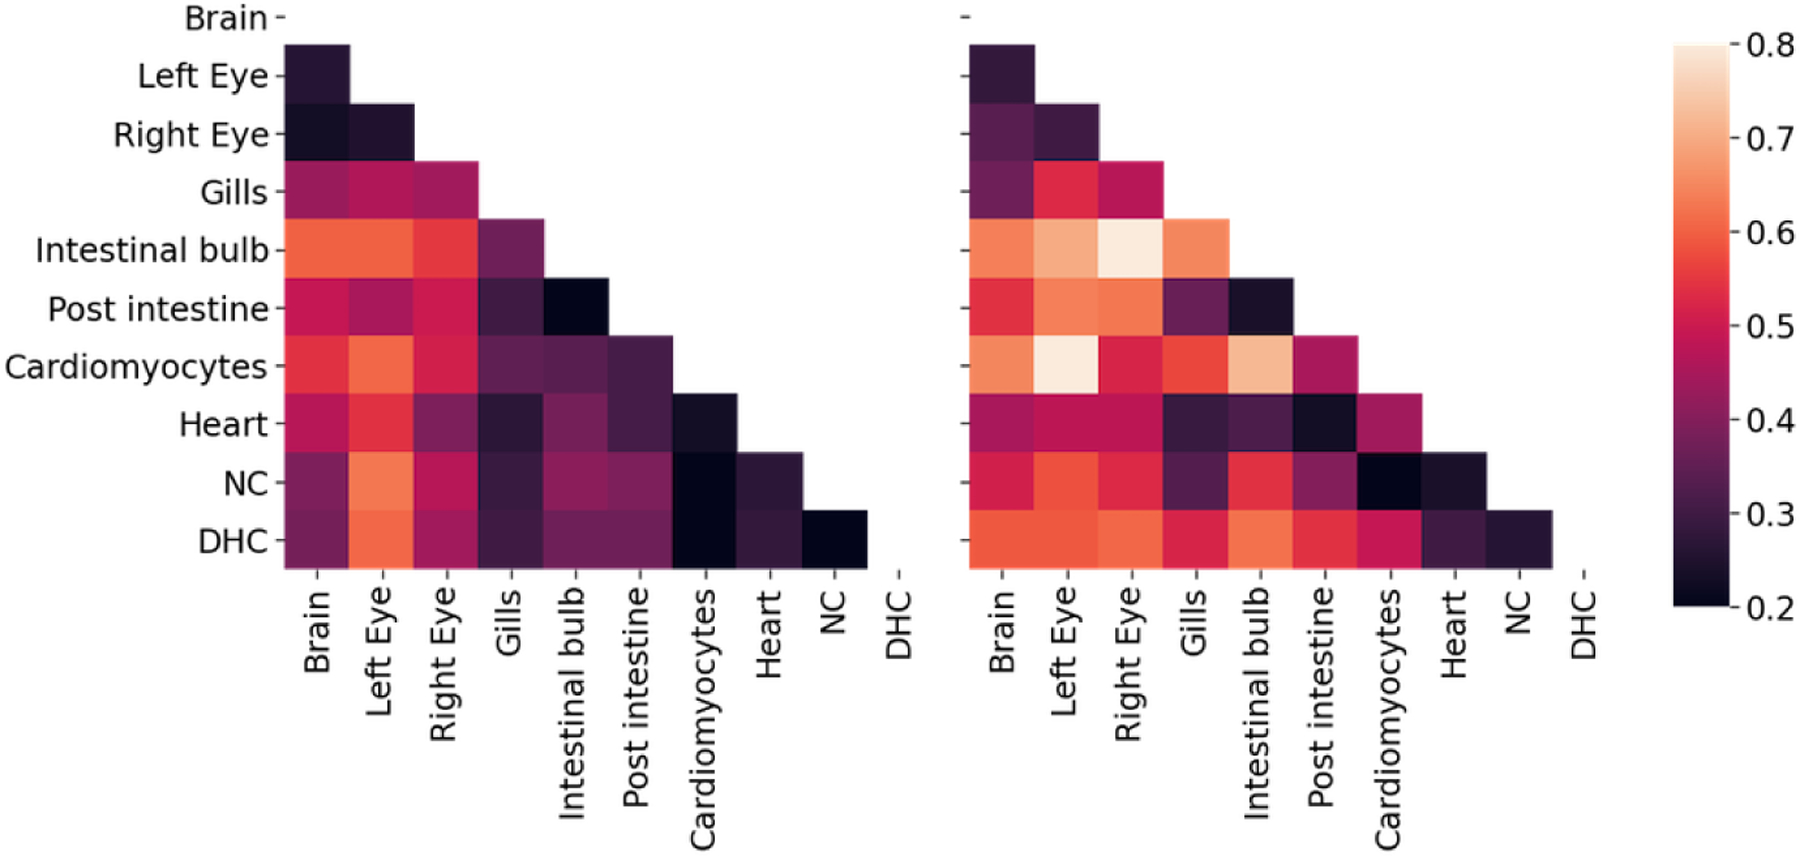
Average distance between tissue sources from adult fish 1 (left) and 2 (right) for tree estimates from GAPML. The distance between tissues is the average time from a leaf of one tissue to the closest internal node with a descendant of the other tissue. The shading reflects distance, where bright means far and dark means close. The tissue distances share similar trends between the two fish. For example, the top (brain and eyes) and lower right (heart-related organs) tend to be the darker regions in both distance matrices.