
Fig 12:
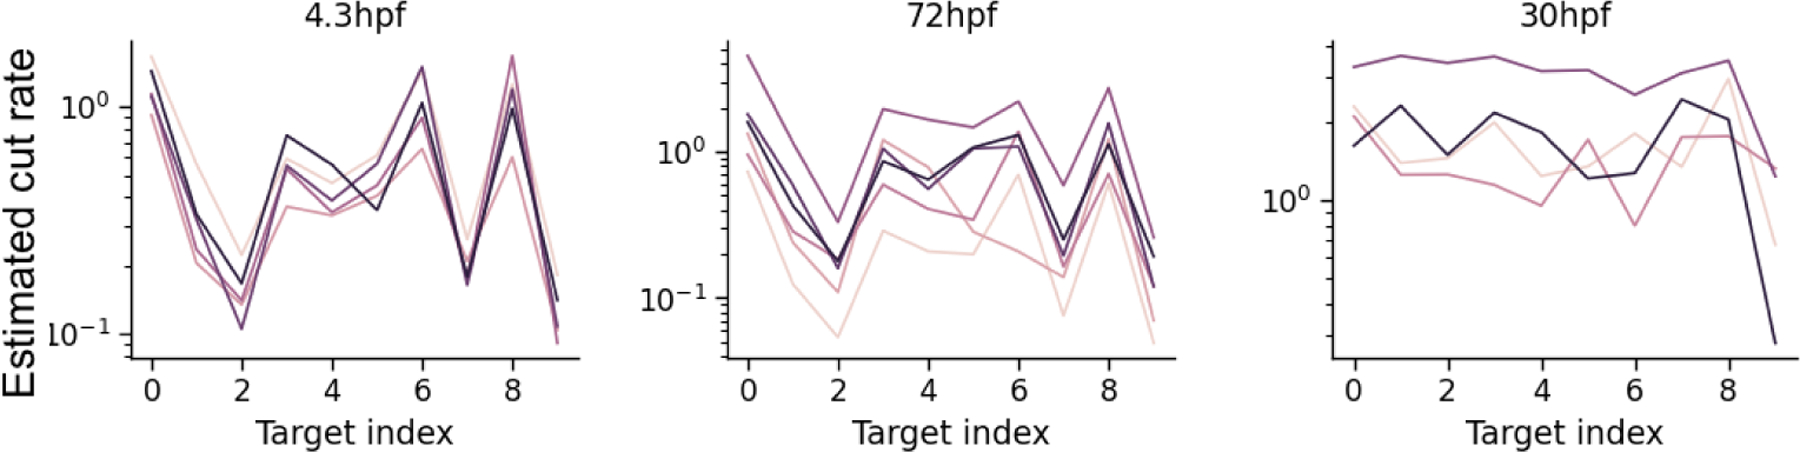
Fitted target lambda rates for fish sampled at different time points; Each line corresponds to estimates for a single fish. Fish sampled at 4.3hpf (left) and 72 hpf (middle) used the same barcode and have similar rate estimates. The 30hpf fish (right) used a different barcode and has different rate estimates.