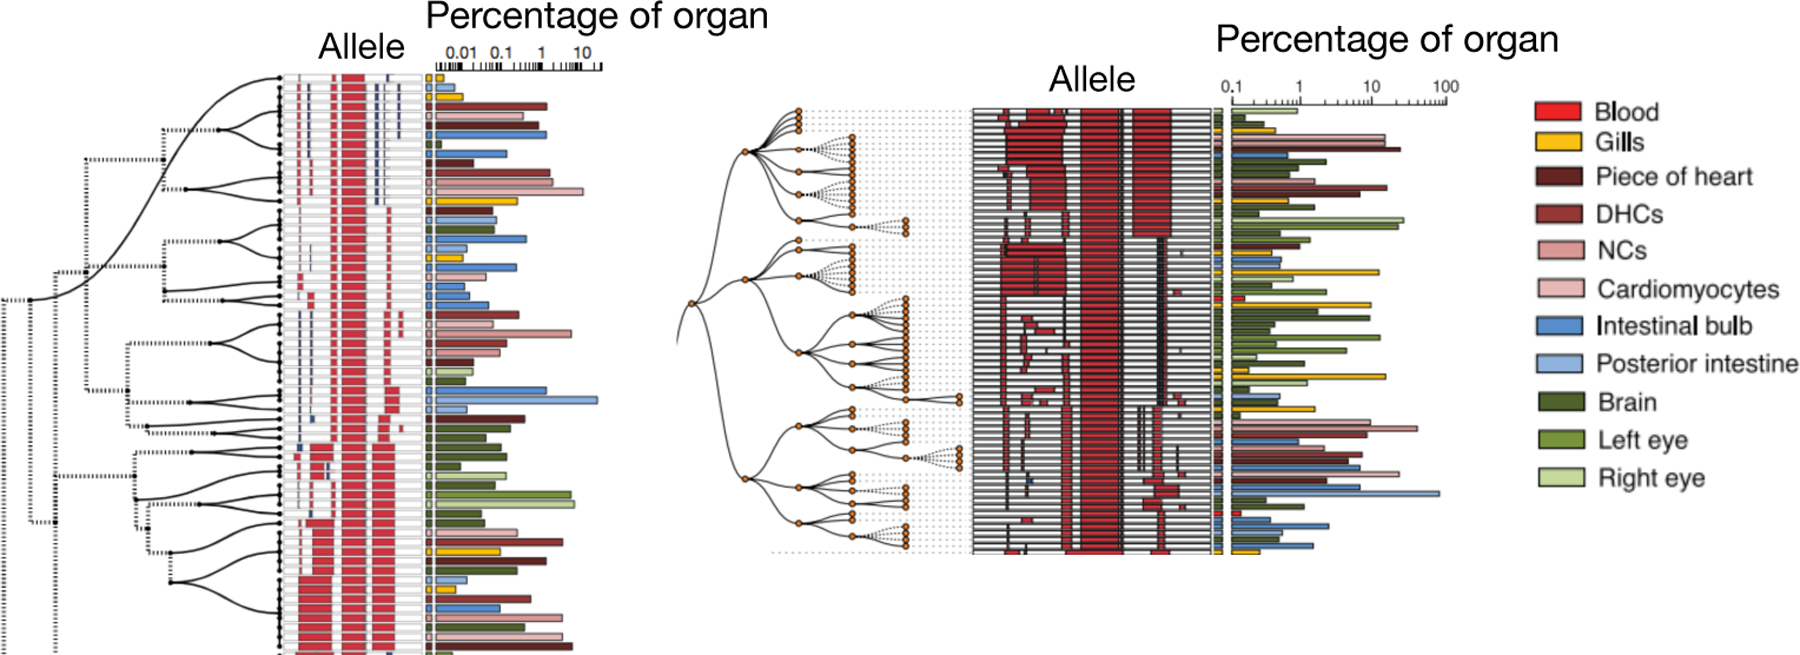
Fig 14:

Subtree from trees estimated using GAPML (left) and Camin-Sokal parsimony (right). Red and blue bars in the allele indicate deletions and insertions, respectively. Alleles observed in multiple organs are plotted on separate lines per organ. The barchart on the right of each subfigure indicates the proportion of cells in that organ represented by each allele. The dashed lines in the GAPML tree correspond to the caterpillar spines.
