
Figure 3:
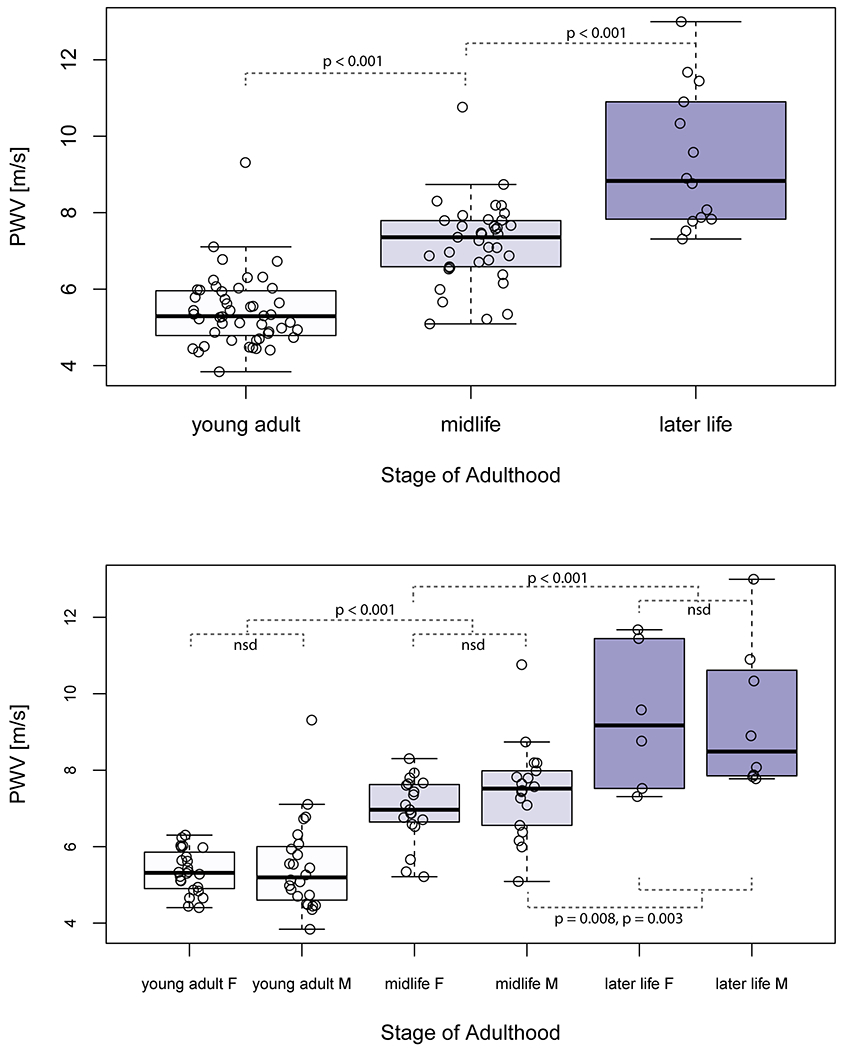
Characterization of aortic PWV measured by 4D flow MRI across the adult lifespan. Boxplots show the median (thick black line), 25% and 75% quartiles (Q1, Q3), whiskers that extend to 1.5(Q3-Q1) and outliers are datapoints beyond the whiskers. Aortic PWV was significantly different between all age-groups (top) in both women and men (F and M, bottom). Significant Bonferroni-adjusted p values are shown. No significant differences (nsd) in aortic PWV were found between women and men in the same age-group.