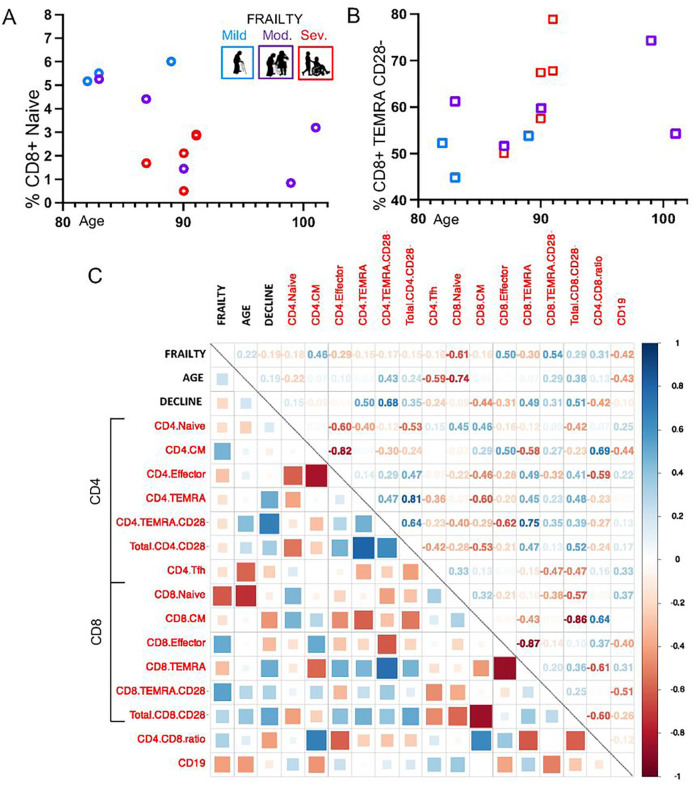
Figure 3. The Immune-Phenotype of Frailty and Old Age.
The hallmarks of immune-senescence were compared in association with participant frailty status and age. (A) CD8+ naïve cells were decreased with higher frailty (p=0.019) and older age (p=0.002), and (B) CD8+ TEMRA CD28− cells were increased with severe frailty (p=0.0048), but not older age (p=0.5). (C) A heat map was used to represent correlation of clinical factors (frailty, age, and functional decline) with T cell memory populations: naïve, central memory (CM), effector, and terminally-differentiated effector memory (TEMRA), and CD28− was used as a marker of T cell aging. The strength of relationship was represented pictographically with boxes (blue is positive, red is negative) and numerically with correlation coefficients. Key results include frailty had the strongest positive correlation with CD8+ TEMRA CD28− cells (r=0.54) and negative correlation with CD8+ naive cells (r=−0.61). Age was negatively correlated with CD8+ naive cells (r=−0.74) and CD4+ TFH cells (r=−0.59). Individuals with increased frailty over the study period, regardless of baseline characteristics, had strong correlations with CD4+ TEMRA CD28− cells (r=0.68)

