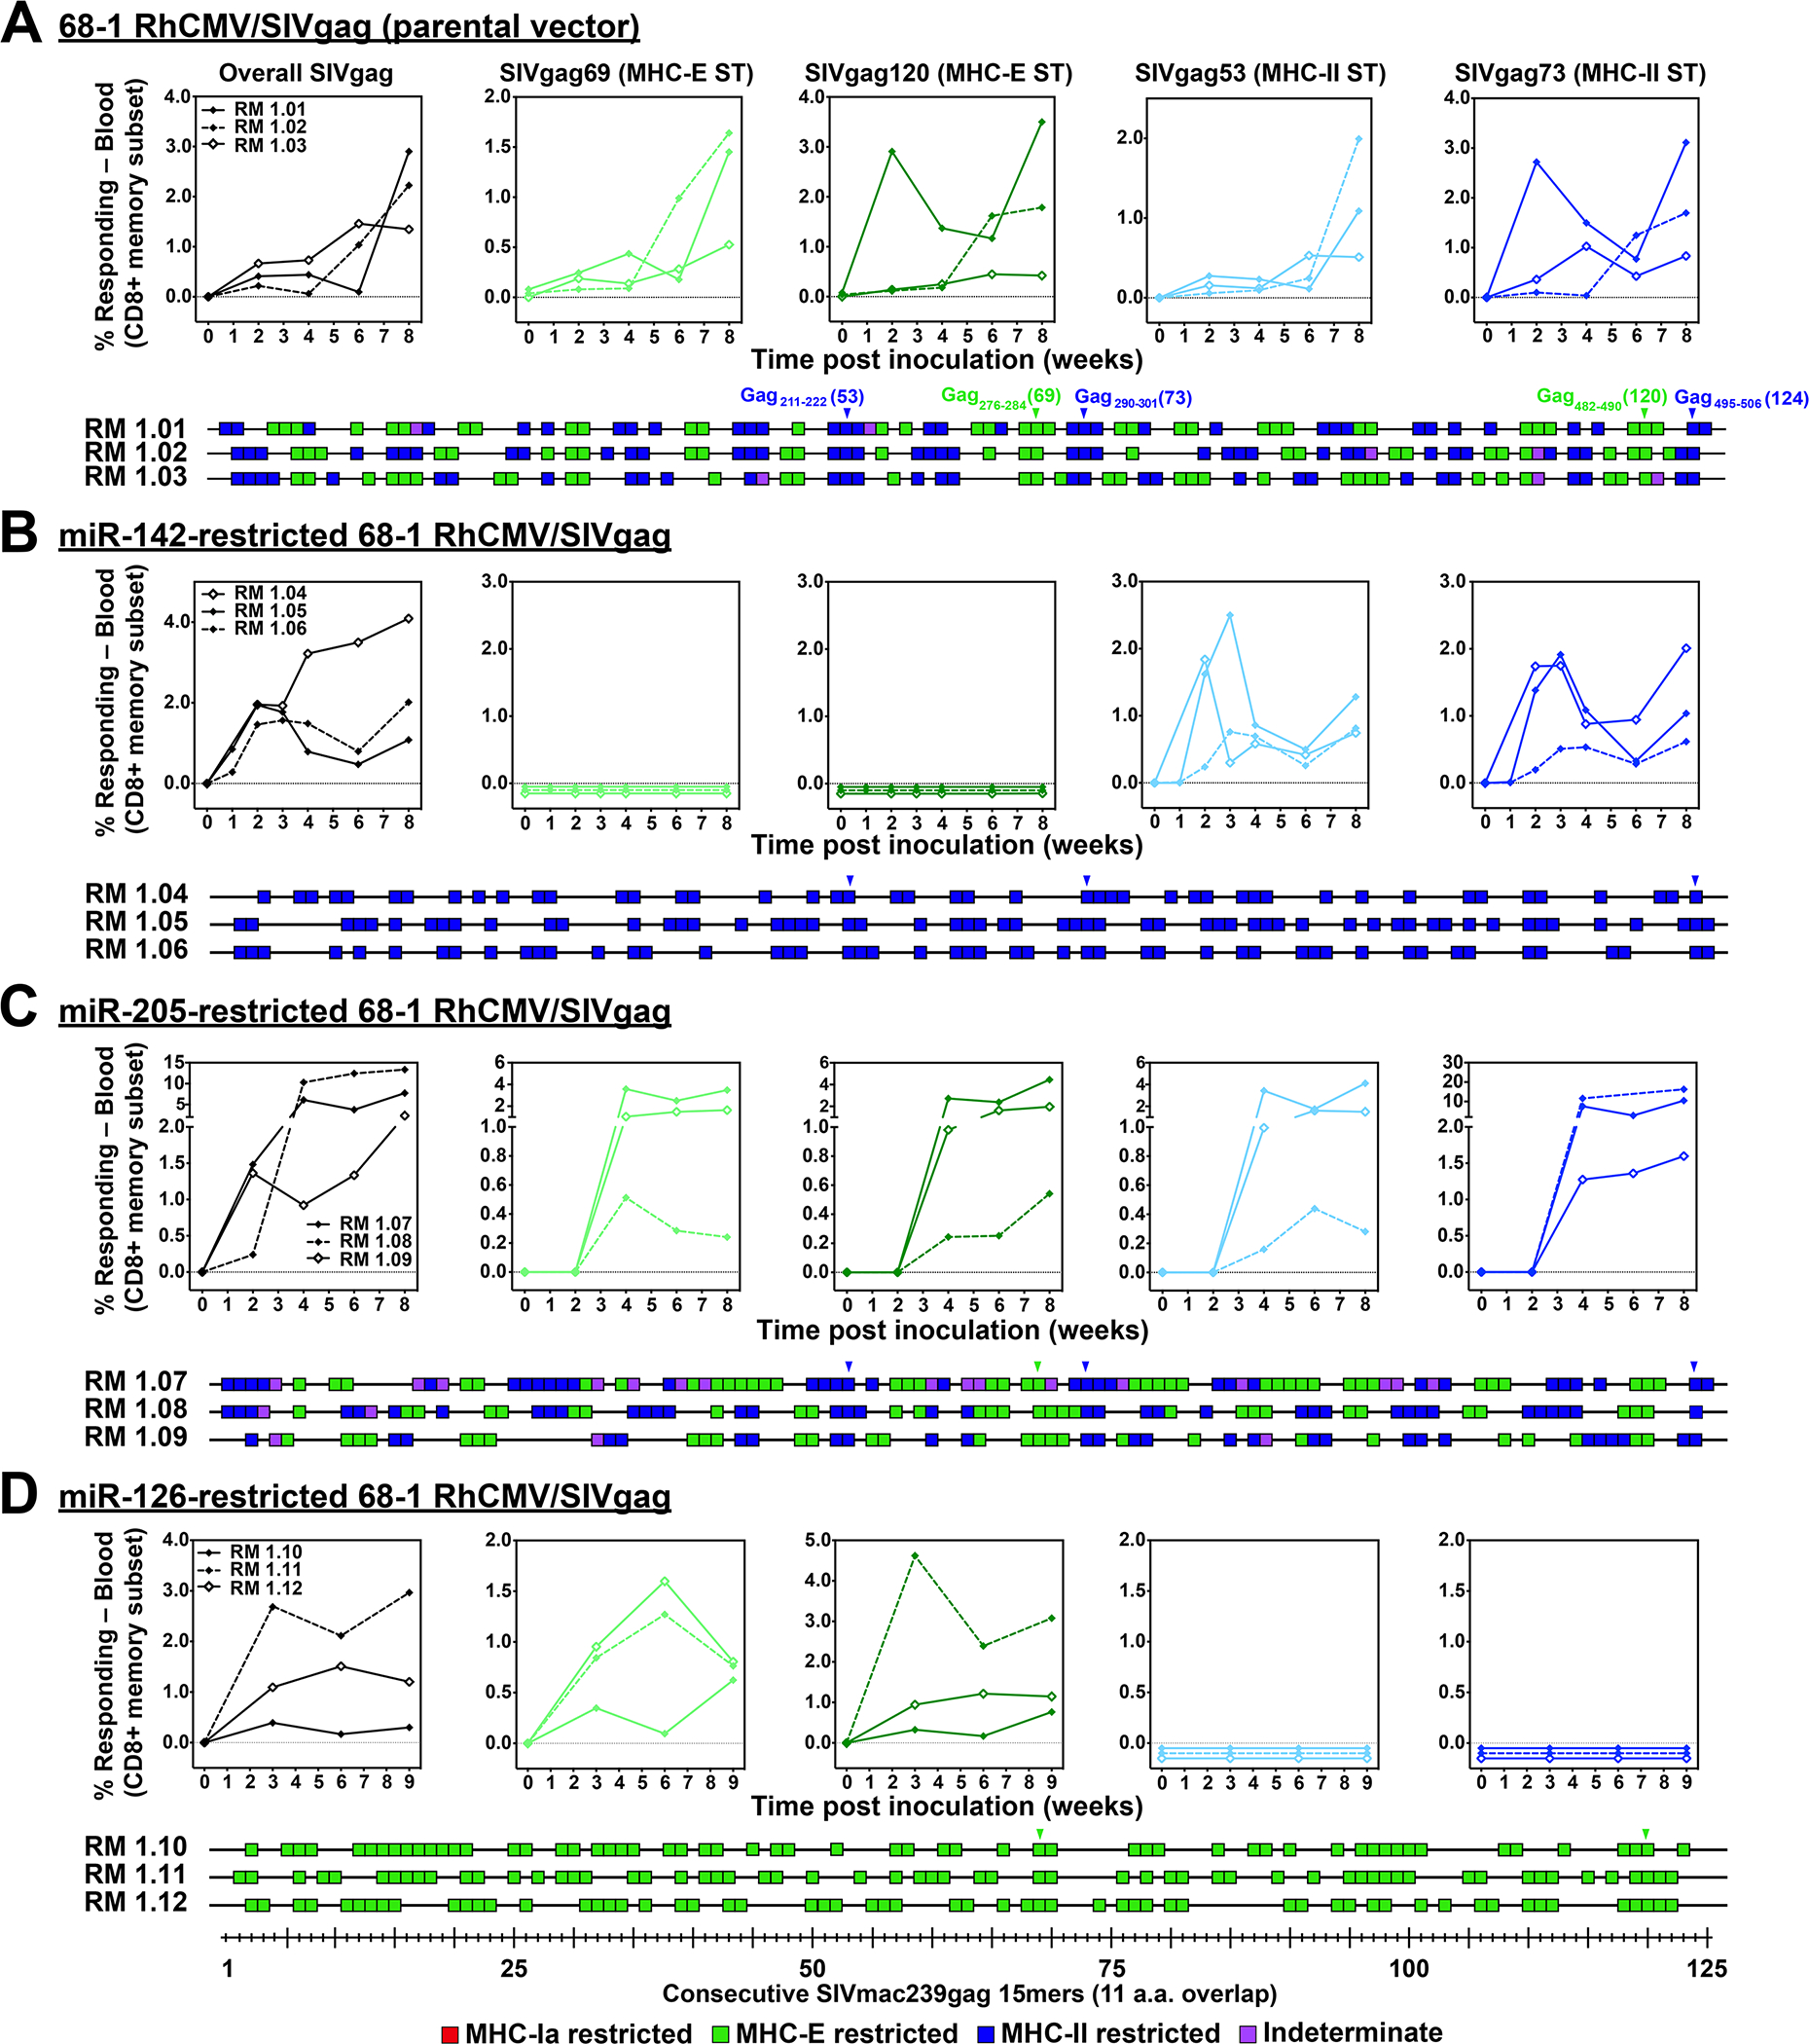
Figure 1. Differential CD8+ T cell immunogenicity of single miR-restricted RhCMV/SIV vectors.

(A-D) Comparison of SIV Gag-specific CD8+ T cell responses elicited by the parental 68–1 RhCMV/SIVgag vector (A) with those of 68–1 RhCMV/SIVgag vectors with miR-142-, miR-205-, and miR-126-mediated tropism restriction (B-D). Peripheral blood CD8+ T cells from 3 representative RMs inoculated with each of these vectors were assessed by flow cytometric ICS assay (TNF-α and/or IFN-γ readout) for responses to 1) a mixture of 125 consecutive 15mer peptides comprising the overall SIV Gag protein sequence (black; top left panels), 2) individual MHC-E (green, top middle panels) and MHC-II-restricted (blue, top right panels) SIV Gag supertopes (STs; MHC-E: Gag69 = Gag276–284, Gag120 = Gag482–490 and MHC-II: Gag53 = Gag211–222, Gag73 = Gag290–301), and 3) each of 125 consecutive 15mer SIV Gag peptides with any above threshold (≥ 0.05% after background subtraction) responses indicated by a box (lower panels). Boxes are colored to reflect MHC restriction based on the ability to inhibit the response with the MHC-E blocking peptide VL9, the MHC-II blocking mAb G46.6, and/or the pan-MHC-I blocking mAb W6/32 (see Methods). Overall analysis of 15mer peptide responses in all RMs vaccinated with these miR-restricted 68–1 RhCMV/SIV vectors are shown in table S2, with estimated epitope densities shown in table S3.
