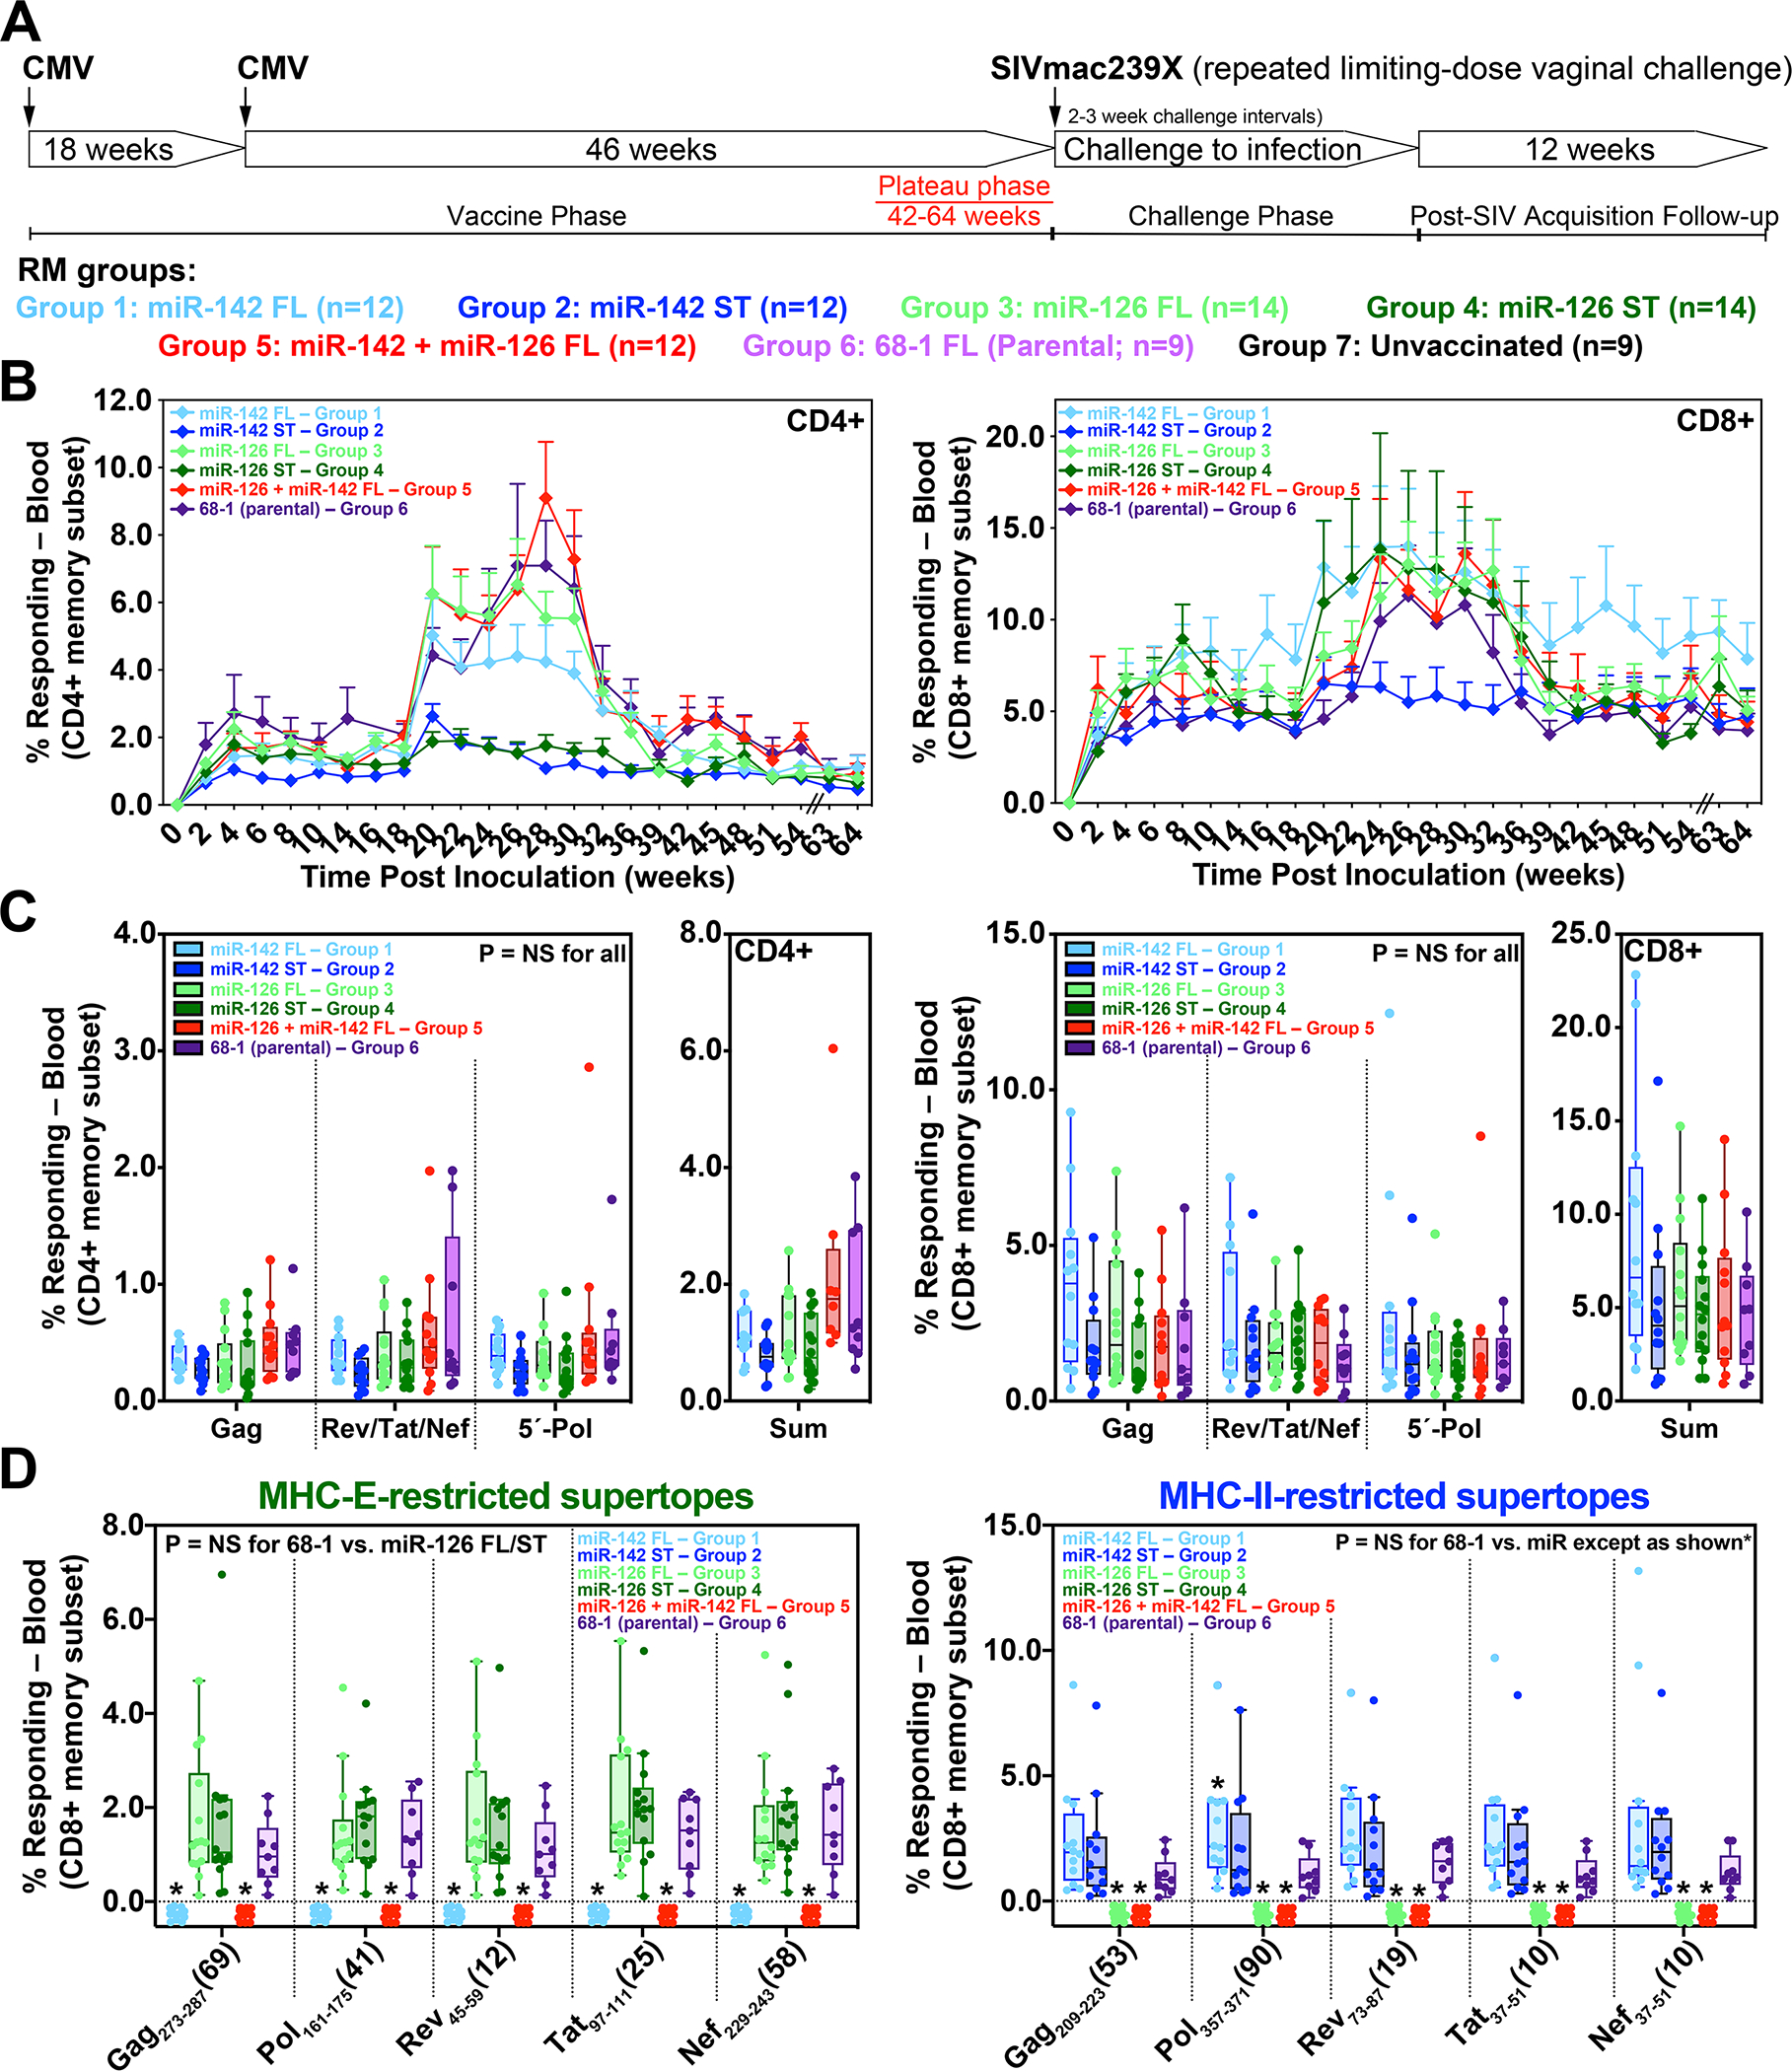
Figure 5. Magnitude and durability of miR-restricted RhCMV/SIV vector-elicited T cell responses.

(A) Protocol for the comparison of the immunogenicity and efficacy of differentially miR-restricted 68–1 RhCMV/SIV vaccine in cycling female RMs, including vector sets composed of 3 vectors individually expressing full length SIV Gag, Retanef, and 5’-Pol inserts, and individual vectors expressing MHC-II and MHC-E supertope-focused inserts. (B,C) Longitudinal and plateau-phase analysis of the vaccine-elicited SIV Gag-, Rev/Tat/Nef-, and 5’-Pol-specific CD4+ and CD8+ T cell responses in peripheral blood of RMs vaccinated with the designated vaccines. In B, the background-subtracted frequencies of cells producing TNF-α and/or IFN-γ by flow cytometric ICS assay to overlapping 15mer peptide mixes comprising each of the SIV inserts within the memory CD4+ or CD8+ T cell subsets were summed for overall responses with the figure showing the mean (+ SEM) of these overall responses at each time point. In C, boxplots compare the individual and summed SIV insert-specific CD4+ and CD8+ T cell response frequencies between the vaccine groups during the vaccine phase plateau (each data point is the mean of response frequencies in all samples from weeks 42–64 post-first vaccination). (D) Plateau phase analysis of the vaccine-elicited CD8+ T cell responses to the designated MHC-E- and MHC-II-restricted SIV supertopes in peripheral blood of the indicated vaccine groups by ICS assay. Note that responses elicited by supertope-focused vectors were only analyzed for type-matched responses (e.g., when the indicated epitopic peptides were present in the insert). Wilcoxon rank sum testing (adjusted for multiple comparisons) was used to compare all response parameters shown in panels C and D for the parental 68–1 vaccine to all other vaccines (which are individually designated by the color code shown in panel A). Significant P-values (< 0.05) are designated by *. ST – supertope; FL – full length.
