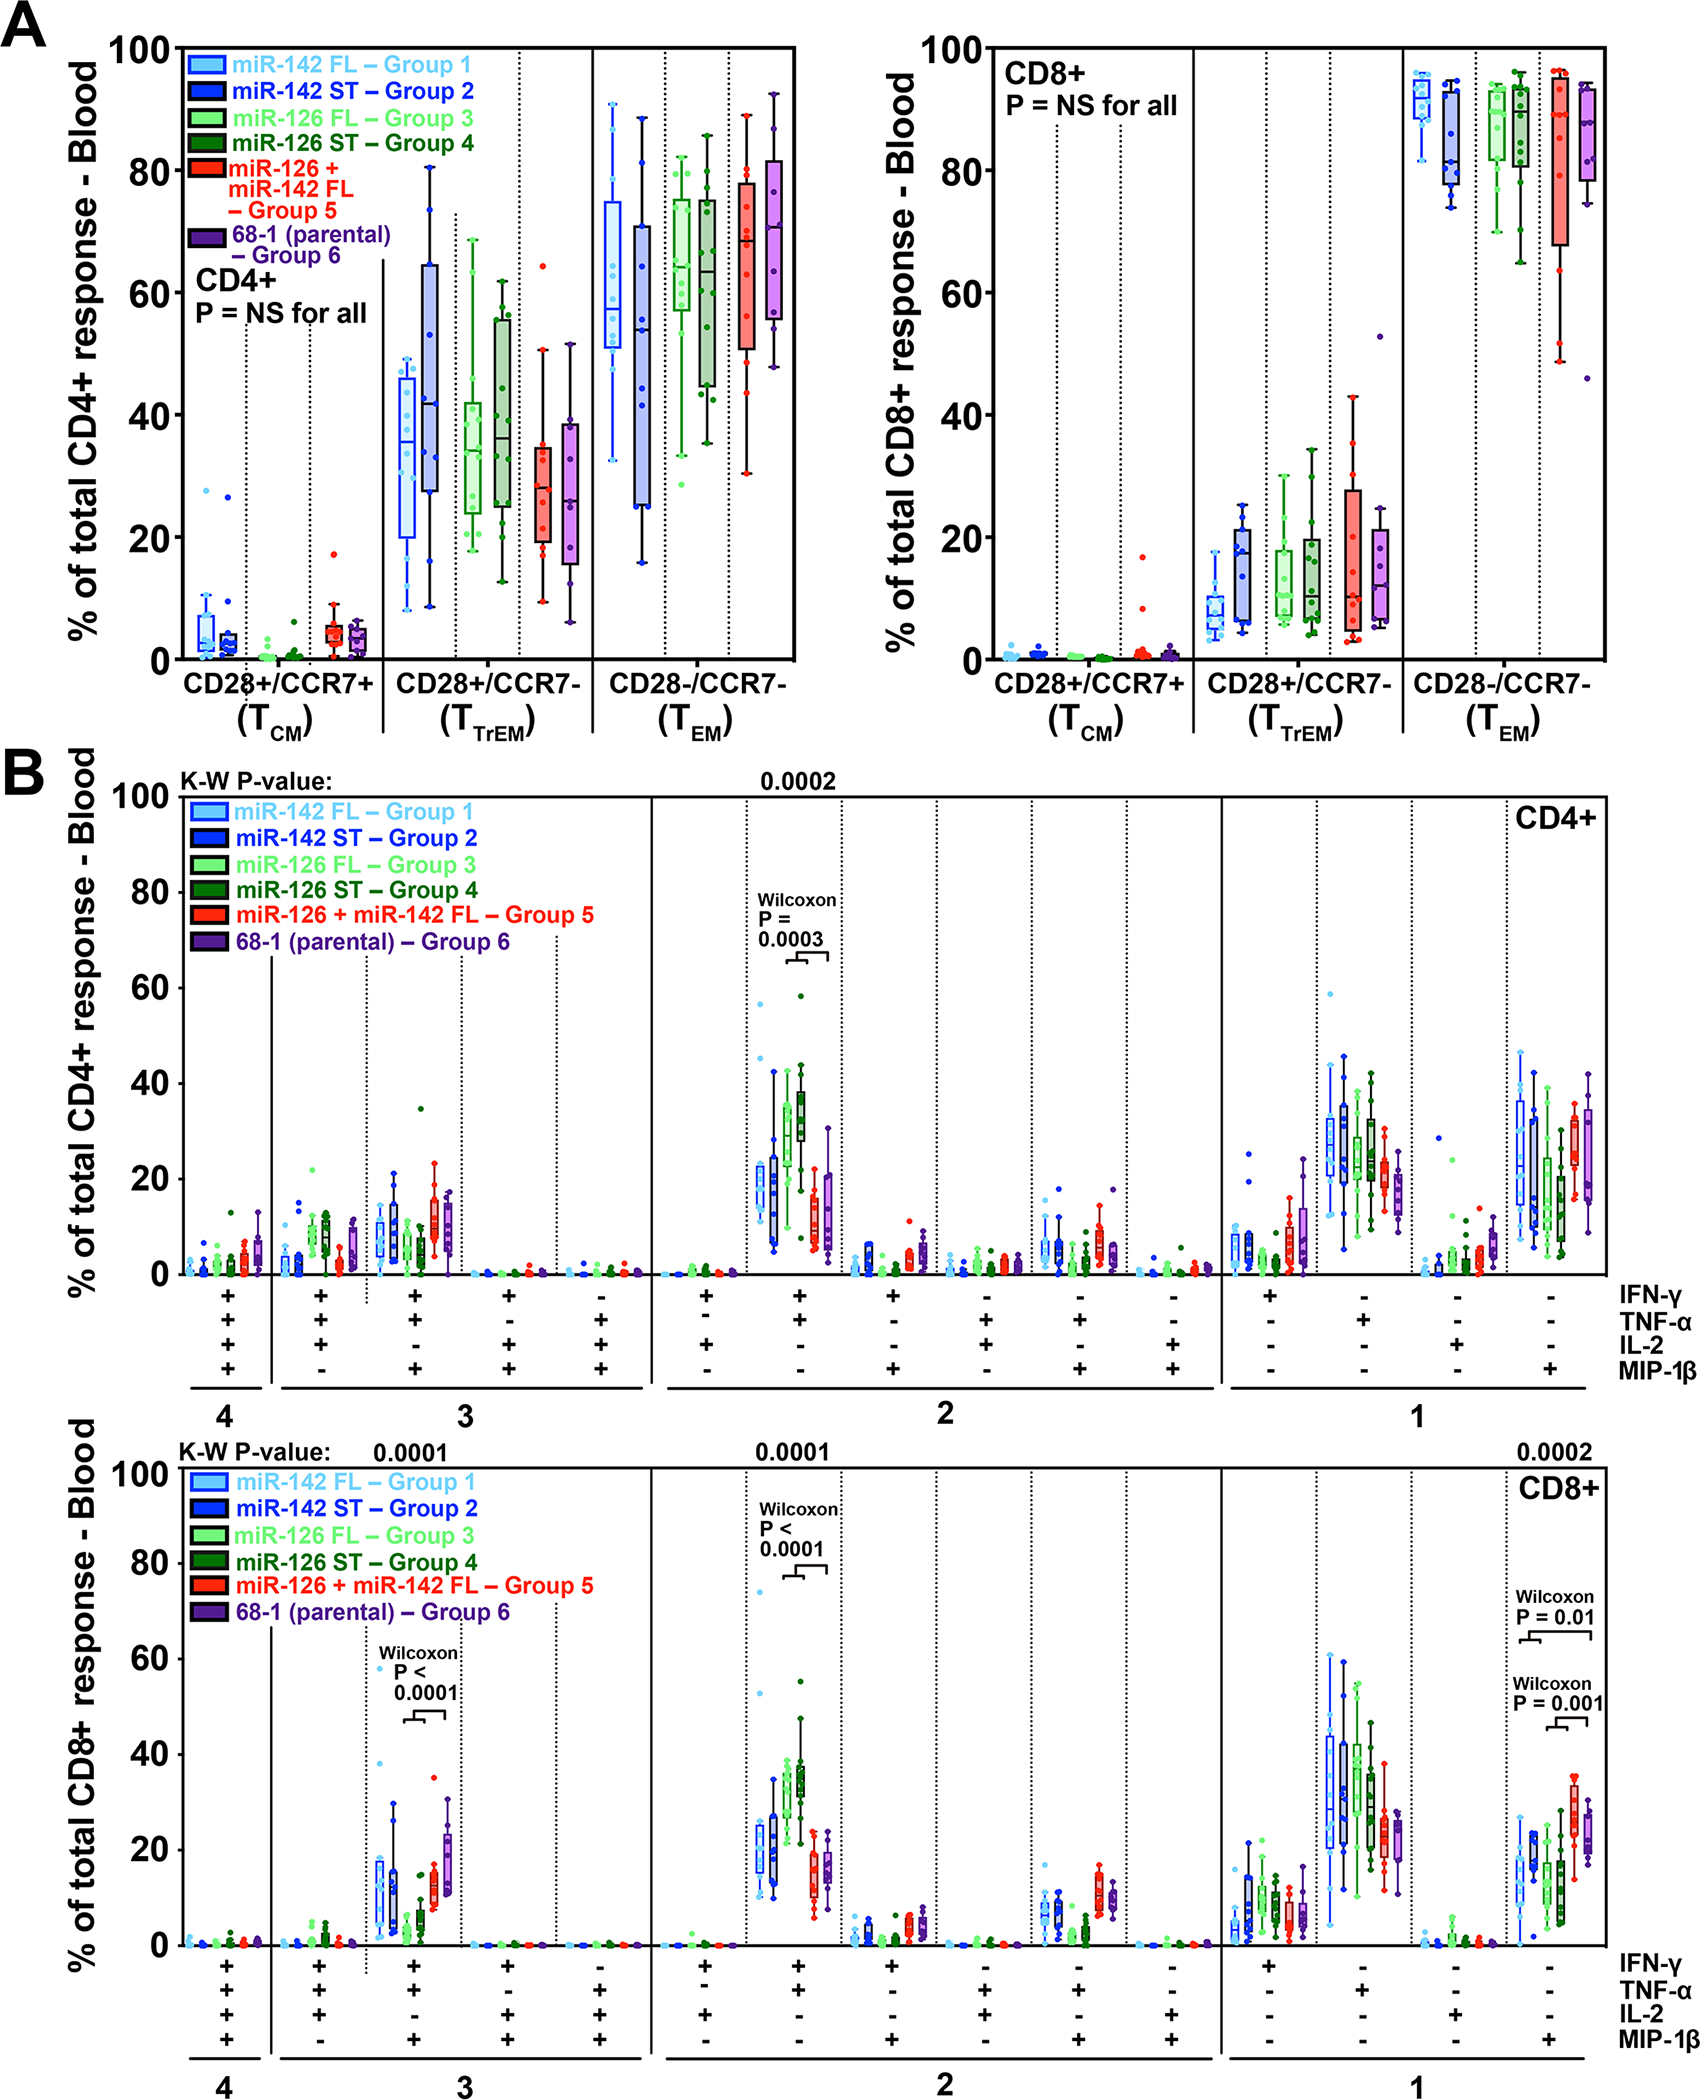
Figure 6. Functional differentiation of miR-restricted RhCMV/SIV vector-elicited T cell responses.

(A) Boxplots compare the memory differentiation phenotype of the vaccine-elicited CD4+ and CD8+ memory T cells in peripheral blood of the same RM cohorts reported in Fig. 5 responding to overall SIV Gag 15mer peptide mix with TNFα and/or IFN-γ production during the post-vaccination plateau phase. Memory differentiation state was based on CD28 and CCR7 expression, delineating central memory (TCM), transitional effector-memory (TTrEM), and effector-memory (TEM), as designated. Kruskal-Wallis P-values comparing response parameters between all treatment groups are shown (adjusted for multiple comparisons). (B) Boxplots compare the frequency of vaccine-elicited CD4+ and CD8+ memory T cells in peripheral blood responding to the overall SIV Gag 15mer peptide mix with TNF-α, IFN-γ, IL-2, and MIP-1β production, alone and in all combinations, in the same samples as panel A. Kruskal-Wallis (K-W) P-values comparing response parameters between all treatment groups are shown where significant (adjusted for multiple comparisons across all fifteen response categories, but only shown for the top four: IFN-γ+/TNF-α+/MIP-1β+, IFN-γ+/TNF-α+, TNF-α+, and MIP-1β+). Where K-W p-values are shown, unadjusted post-hoc Wilcoxon P-values are also shown where significant, comparing miR-142 and miR-126 treatment groups (with supertope-focused and full length insert groups pooled) to 68–1. ST – supertope; FL – full length.
