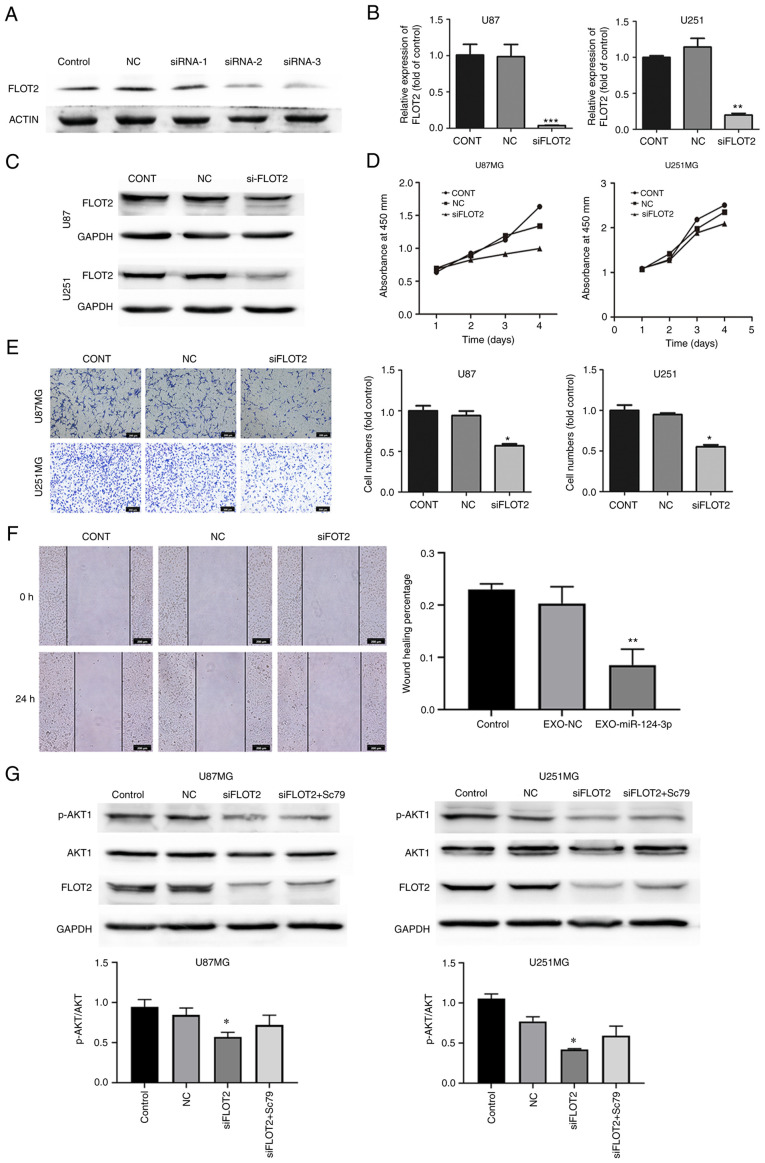
Figure 4.
NSC-EXOs loaded with miR-124-3p suppress glioma cell progression via the FLOT2/AKT pathway. (A) Western blot analysis was used to examine FLOT2 expression following siRNA knockdown. (B) The efficiency of si-FLOT2 knockdown was determined using reverse transcription-quantitative PCR. (C) FLOT2 protein expression in glioma cells was detected using western blot analysis. (D) The proliferative ability of glioma cells transfected with si-FLOT2 or NC was examined using CCK-8 assay; the x axis represents the days. (E) Cell invasion was determined using Transwell invasion assay in glioma cells transfected with si-FLOT2 (original magnification, ×100). (F) Cell migration was detected using wound healing assay in glioma cells transfected with si-FLOT2 (original magnification, ×100). *P<0.05, **P<0.01 and ***P<0.001, statistically significant differences between the NC and siFLOT2 group. (G) FLOT2 and AKT1 expression was detected following the use of Sc79. Data are presented as the mean ± SD of three independent experiments. *P<0.05, statistically significant difference the siFLOT2 and siFLOT2 + Sc79 group. NC, siRNA negative control; NSC, neural stem cell; EXOs, exosomes; FLOT2, flotillin 2.

