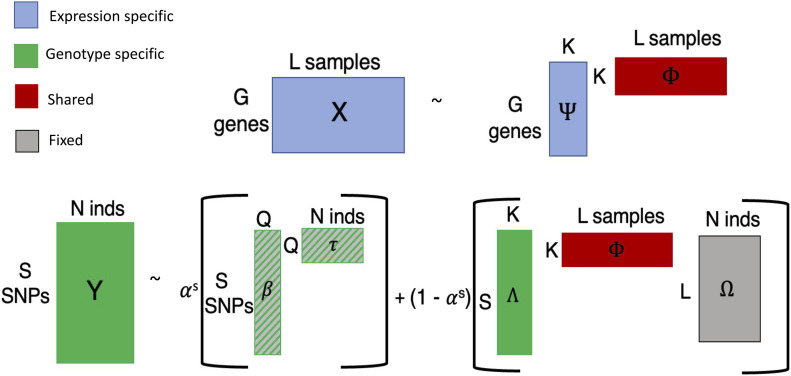
Figure 6. Model visualization.
Explicit representation of the model described in Materials and Methods section Equations (1)–(9) with dimensions drawn out. Each portion of the model is color-coded according to modality. Gray represents the known mapping between samples and individuals. The ancestry portion is striped because it is learned before fitting the shared model portion.

