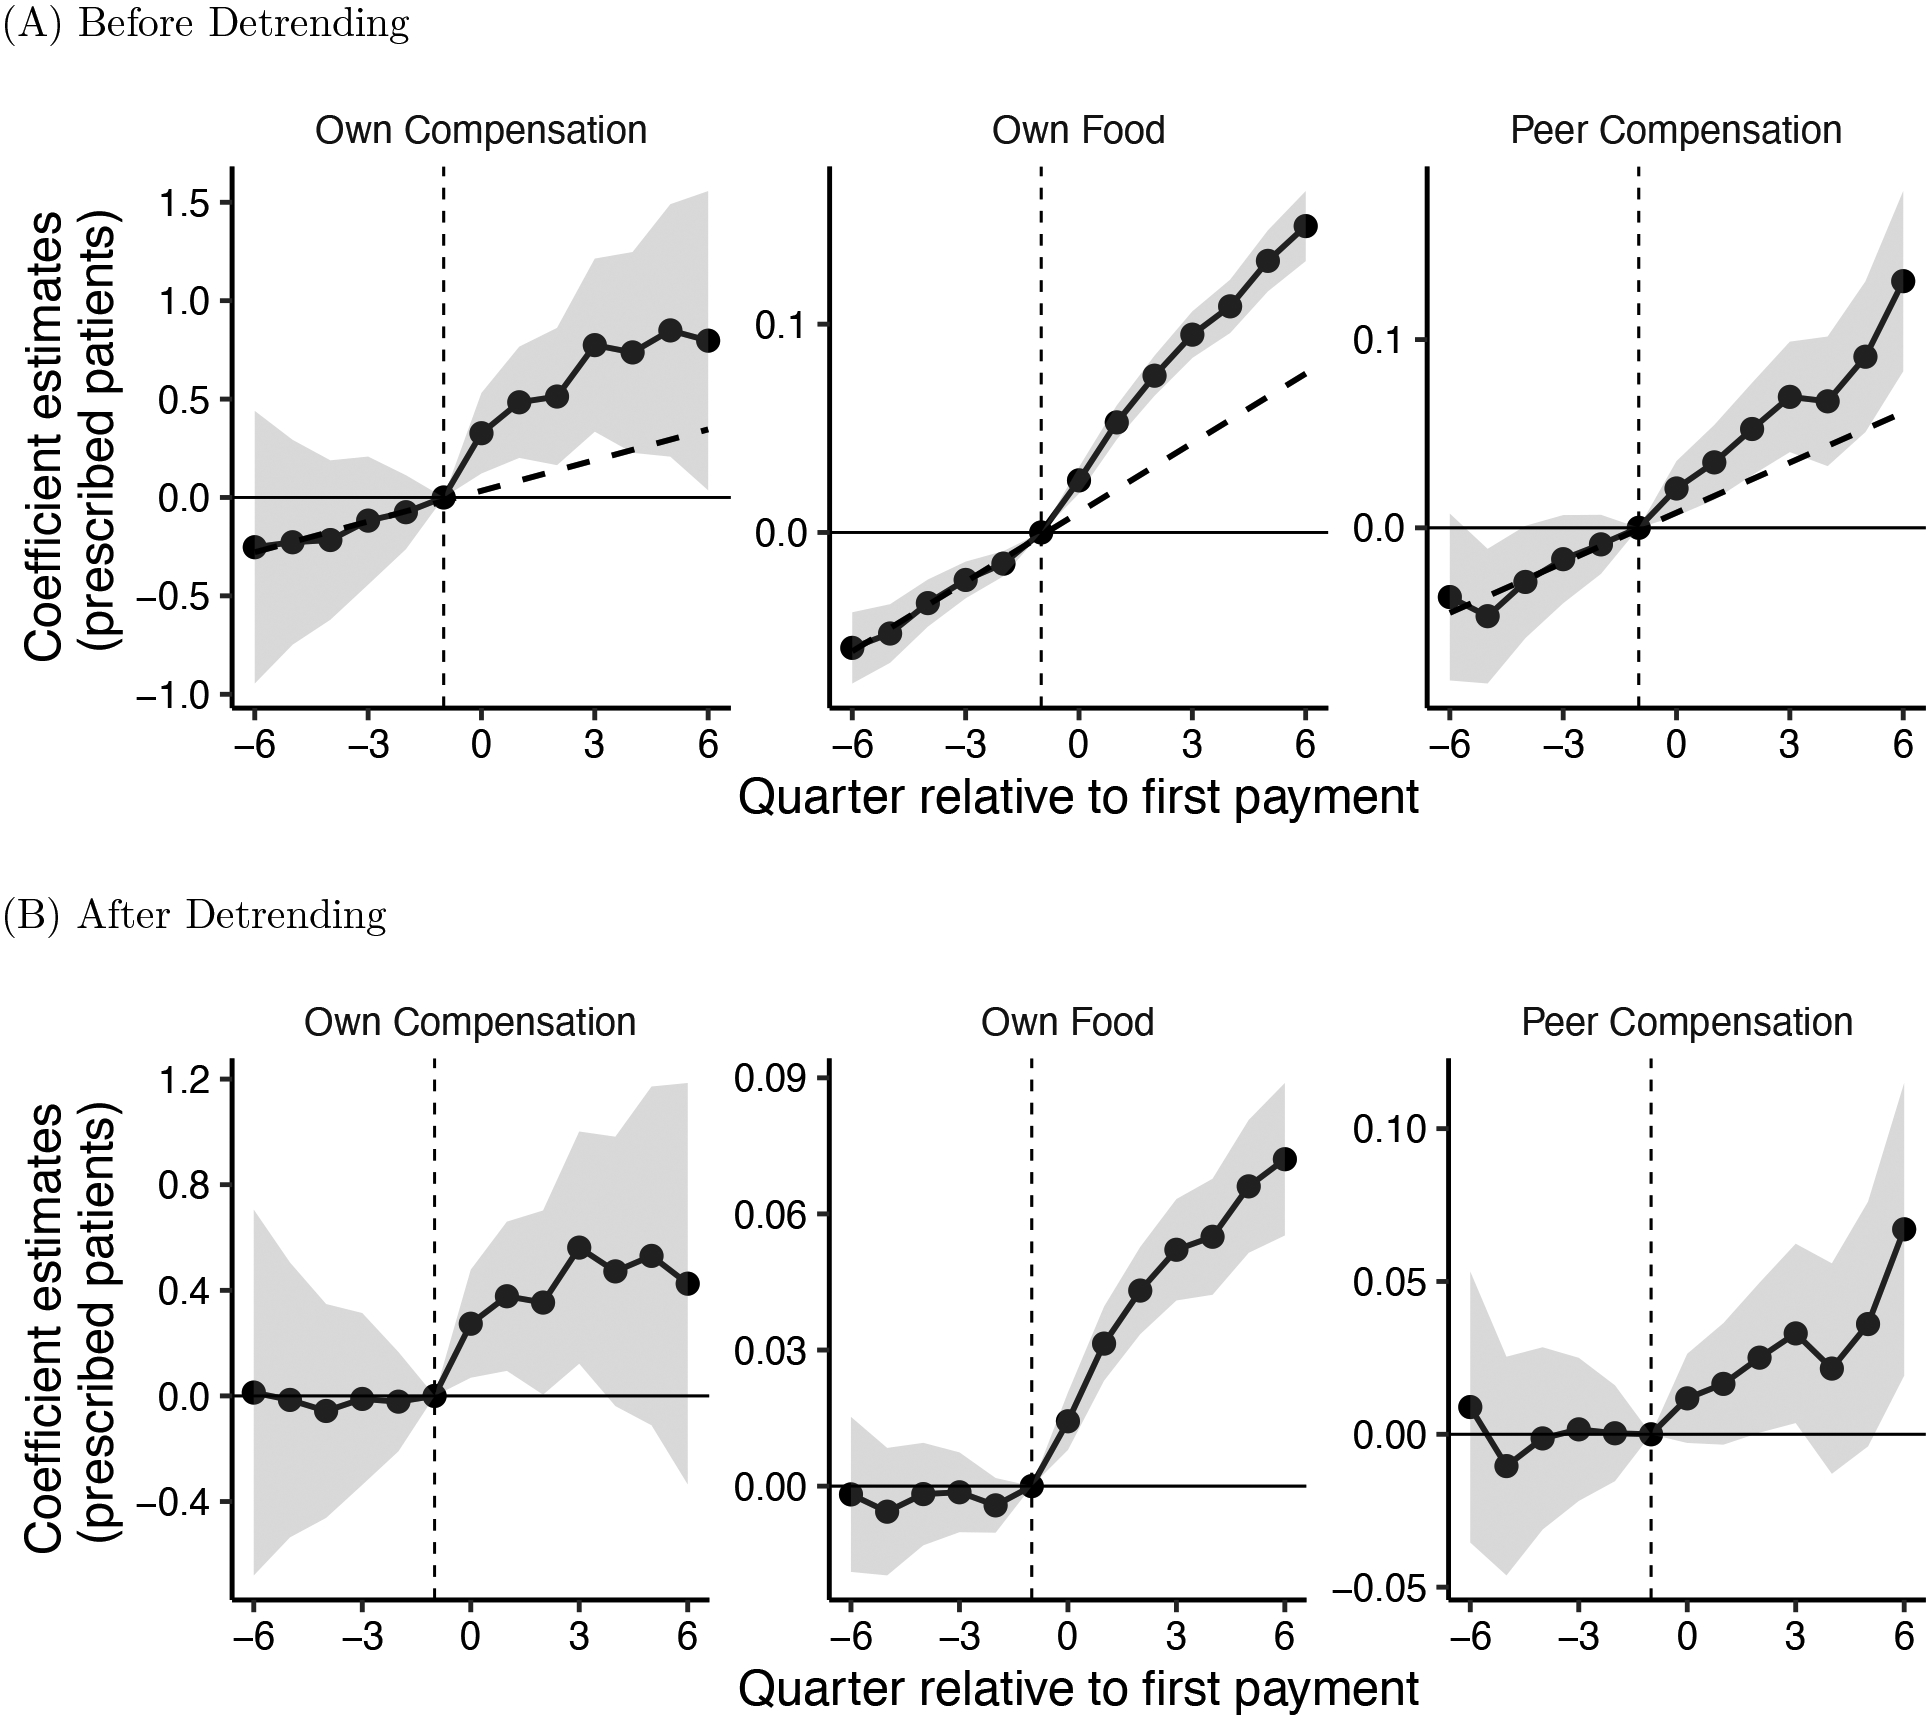
Figure 1:

Event Study: The Impact of Payments on Prescription Volume
Notes: Figure shows event study coefficients estimated from equation (1), showing the response of physicians to own and peer payments of different types. The facets show coefficients for different payment types—own food, own compensation, and peer compensation—that were all jointly estimated using 5,467,536 doctor-drug-quarter observations. Panel (A) reports coefficients from a single regression that excludes a differential pre-trend for paid physicians; a dashed line is fitted to the pre-trend for illustration. Panel (B) reports coefficients from a single regression after detrending, using the two-step procedure described in Section 2. All regressions also include variables for peer food, own travel, and peer travel, alongside fixed effects for doctor-drug and drug-specialty-quarter. Quarter 0 indicates the quarter of the first payment of each type. Shaded areas show 95 percent confidence intervals. Note that facet vertical axes have different scales.
