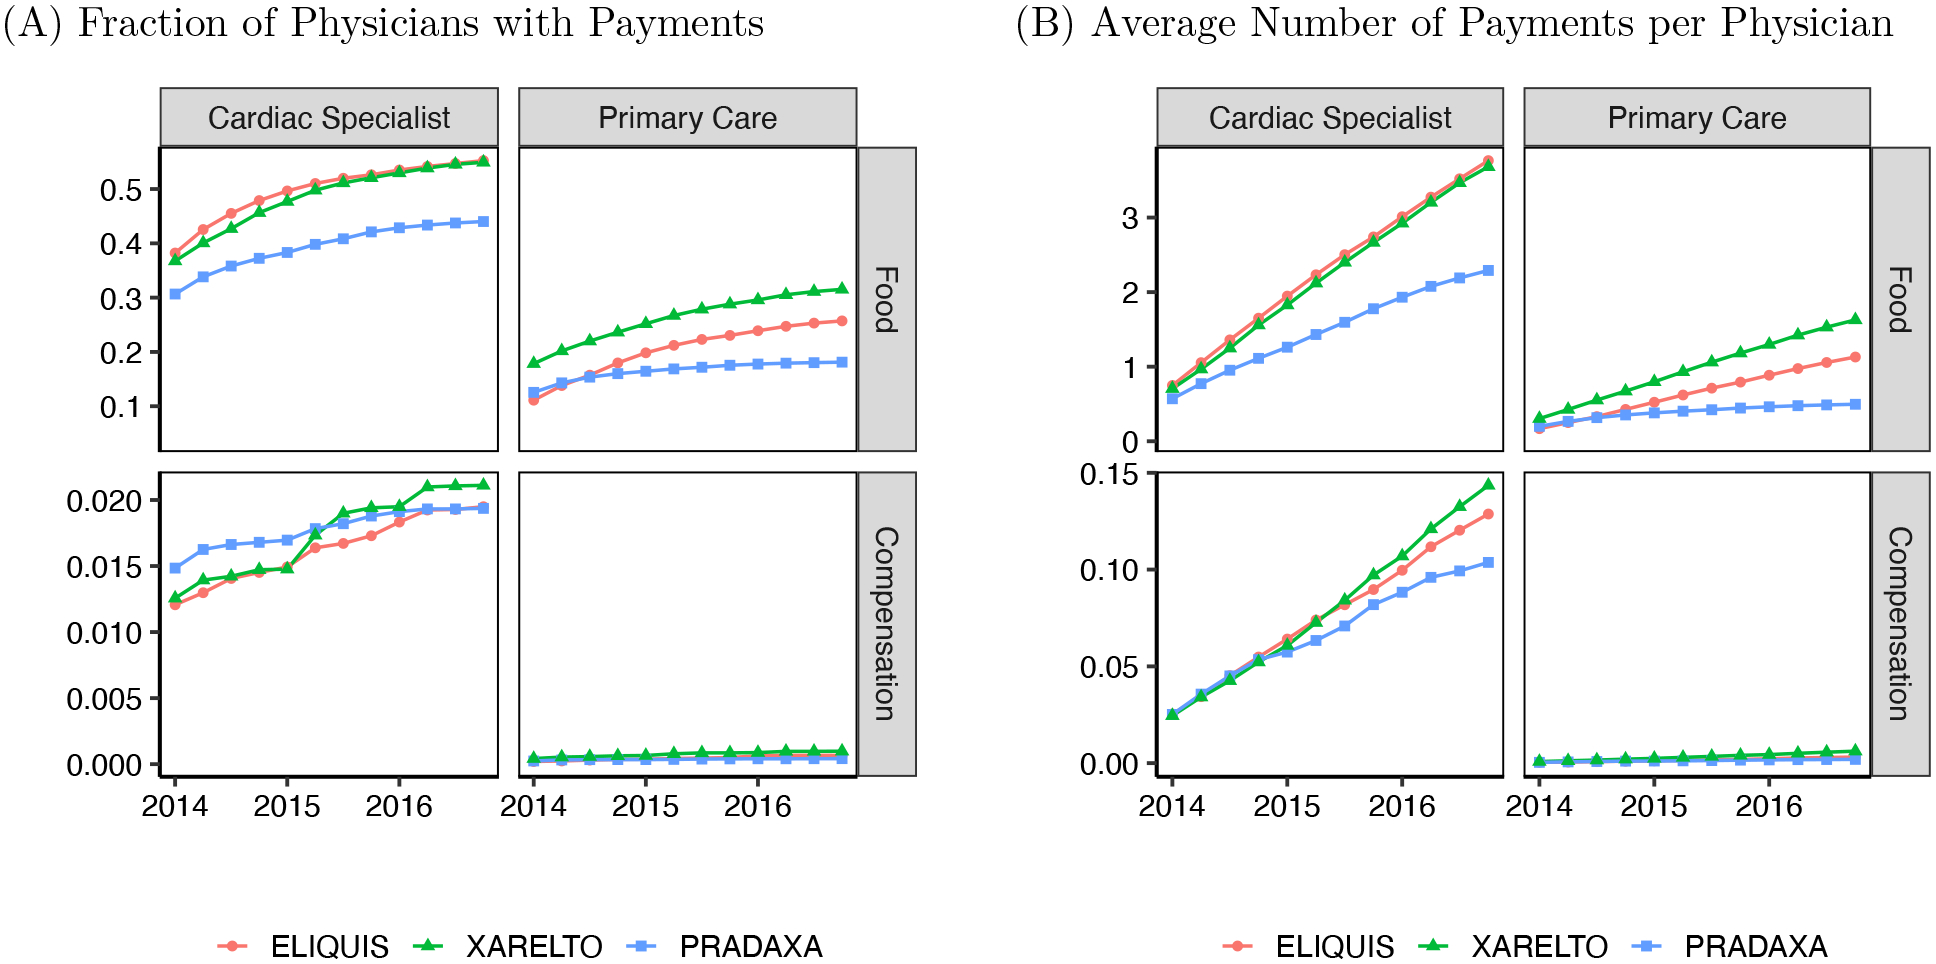
Figure 3:

Cumulative Payments over Time, by Type of Payment and Medical Specialty
Notes: Figures show cumulative information on the volume of payments associated with each of the three NOACs in our sample. Panel A shows the fraction of physicians who received at least one payment. Panel B shows information on the average number of payments per physician, including zero payments. Note that facet vertical axes have different scales. In each panel, column of facets shows data for a different medical specialty: cardiac specialties (left) and primary care (right). Each row of facets shows payments of a different type: Food category includes education, food, and beverage transfers; Compensation includes compensation for services and consulting fees. Section 1 describes the specialty and payment category definitions.
