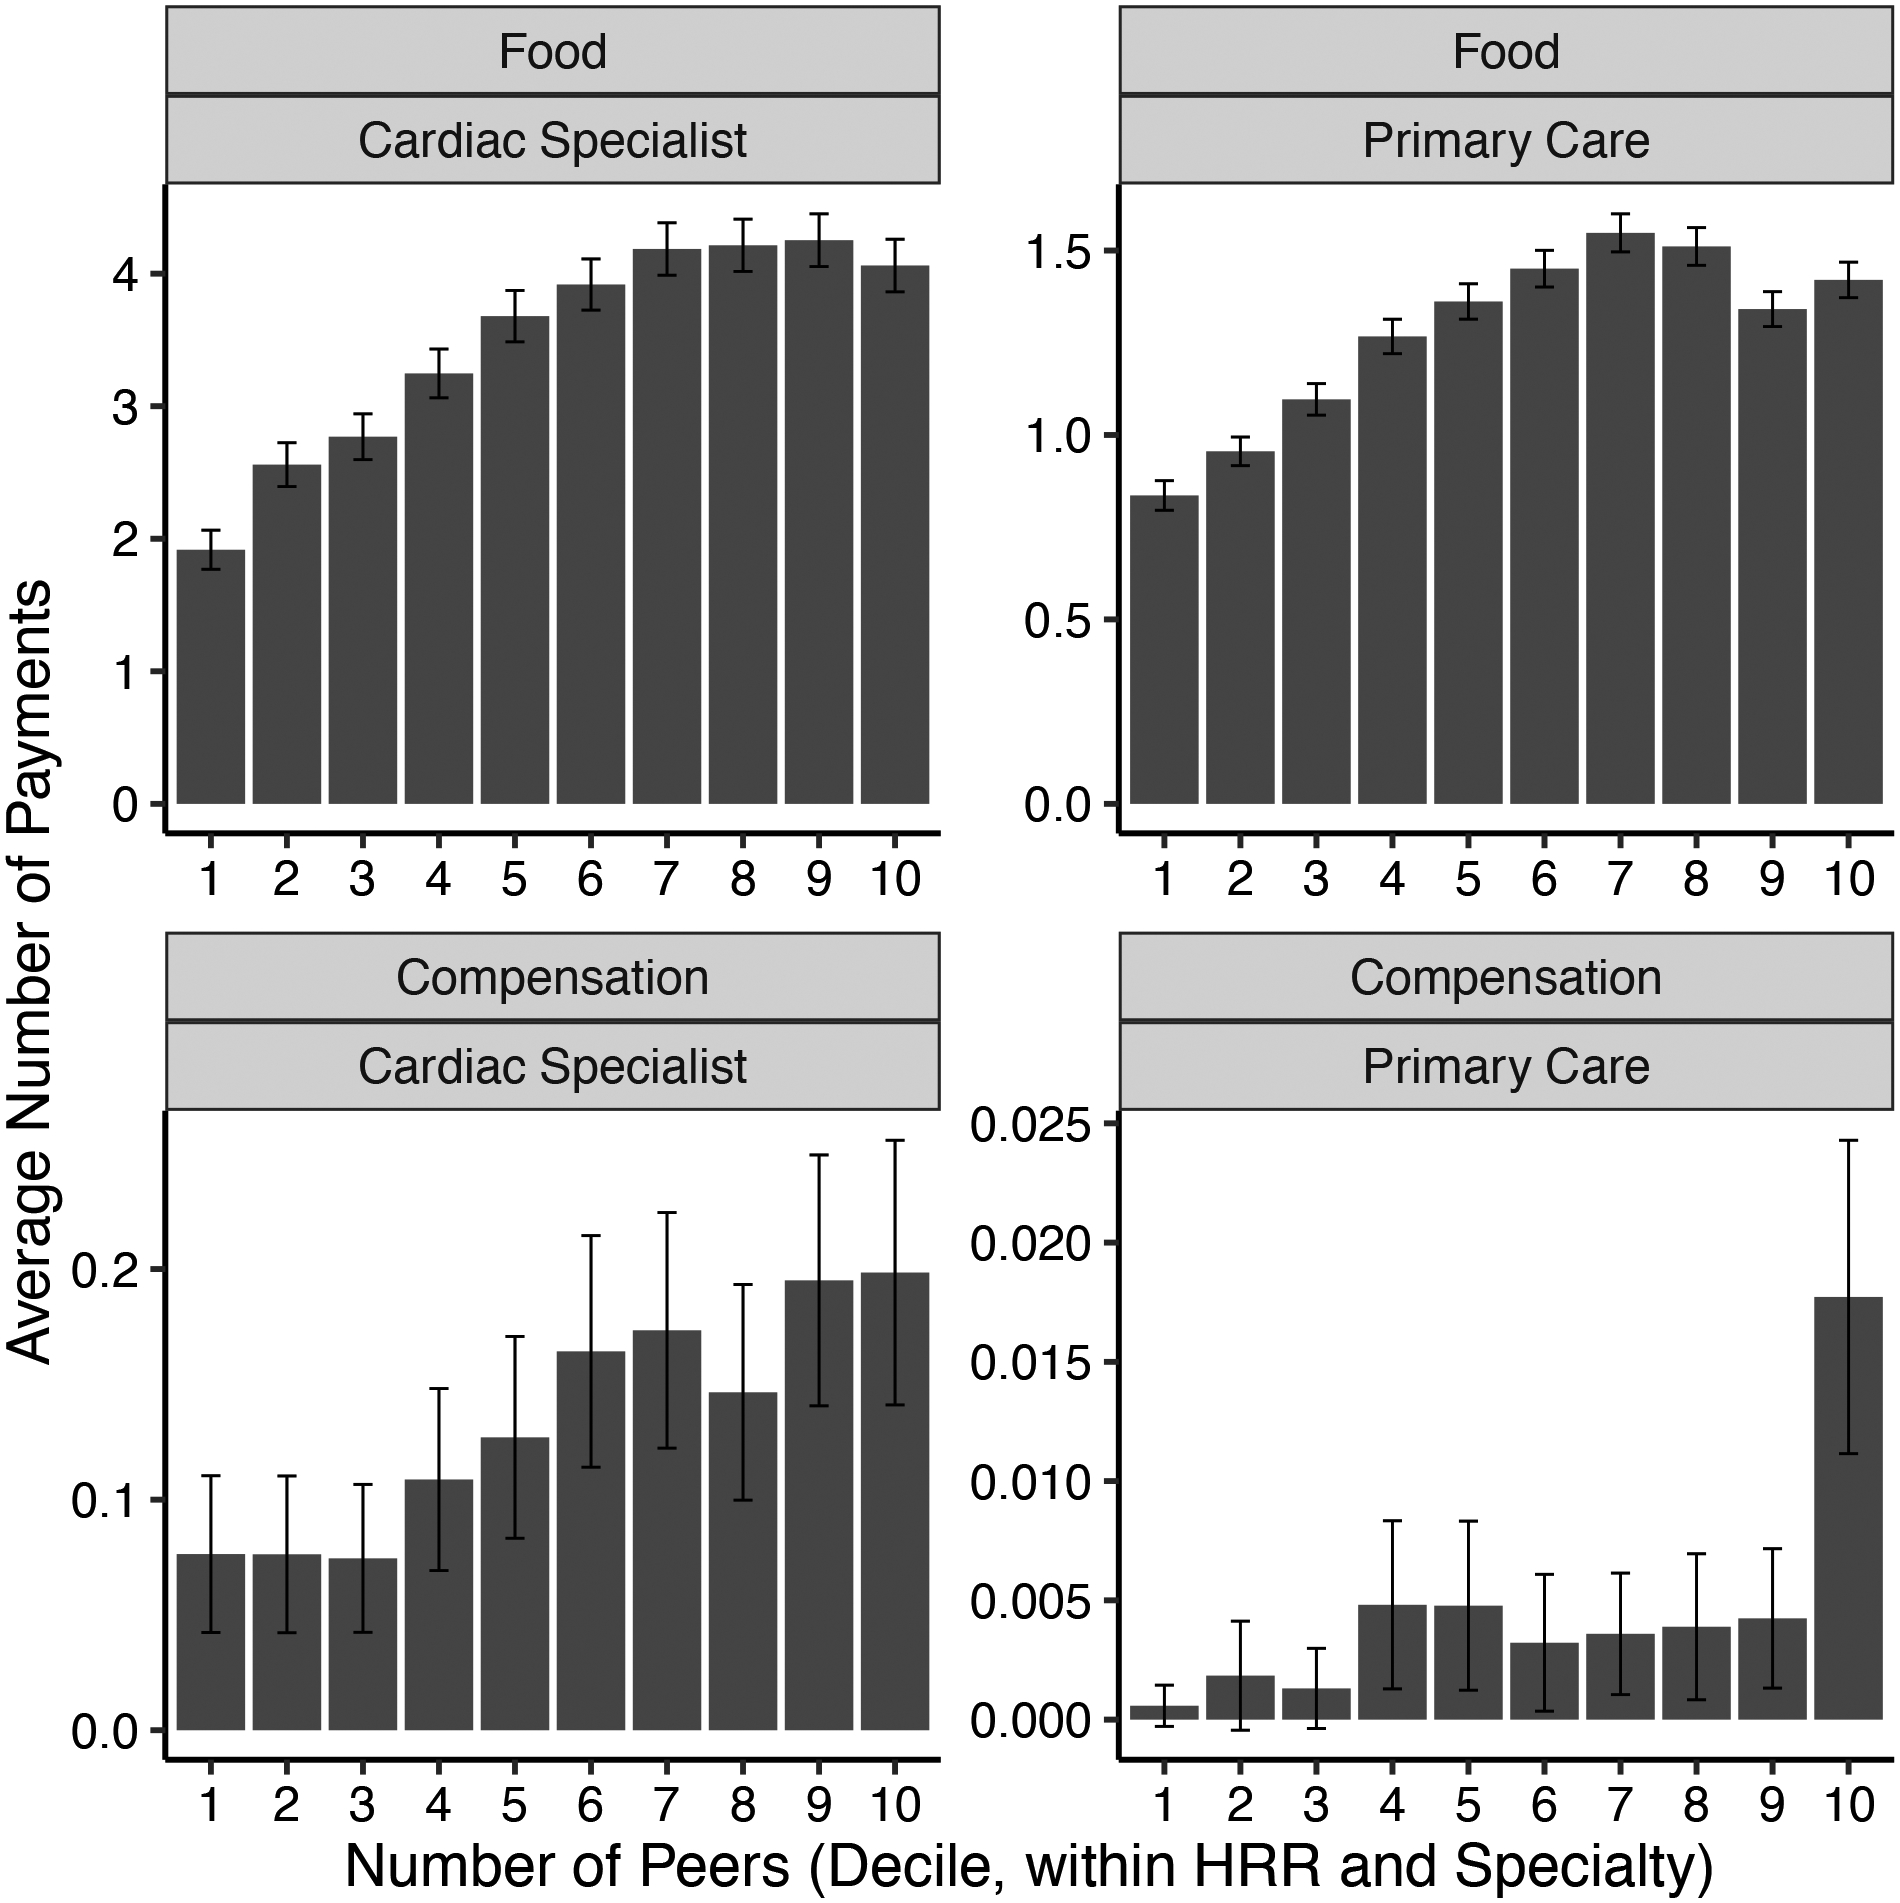
Figure 4:

Average Number of Payments by Recipient Number of Peers
Notes: For each specialty and type of payment, figure shows the average number of payments made to each physician (y-axis), by deciles of the recipient’s number of peers (x-axis). Deciles are calculated separately for each HRR and specialty. Error bars show 95 percent confidence interval for the mean. Note that facet vertical axes have different scales. Each row of facets shows payments of a different type: Food category includes education, food, and beverage transfers; Compensation includes compensation for services and consulting fees. Each column shows data for a different medical specialty: cardiac specialties (left) and primary care (right). For specialty definitions see Section 1.
