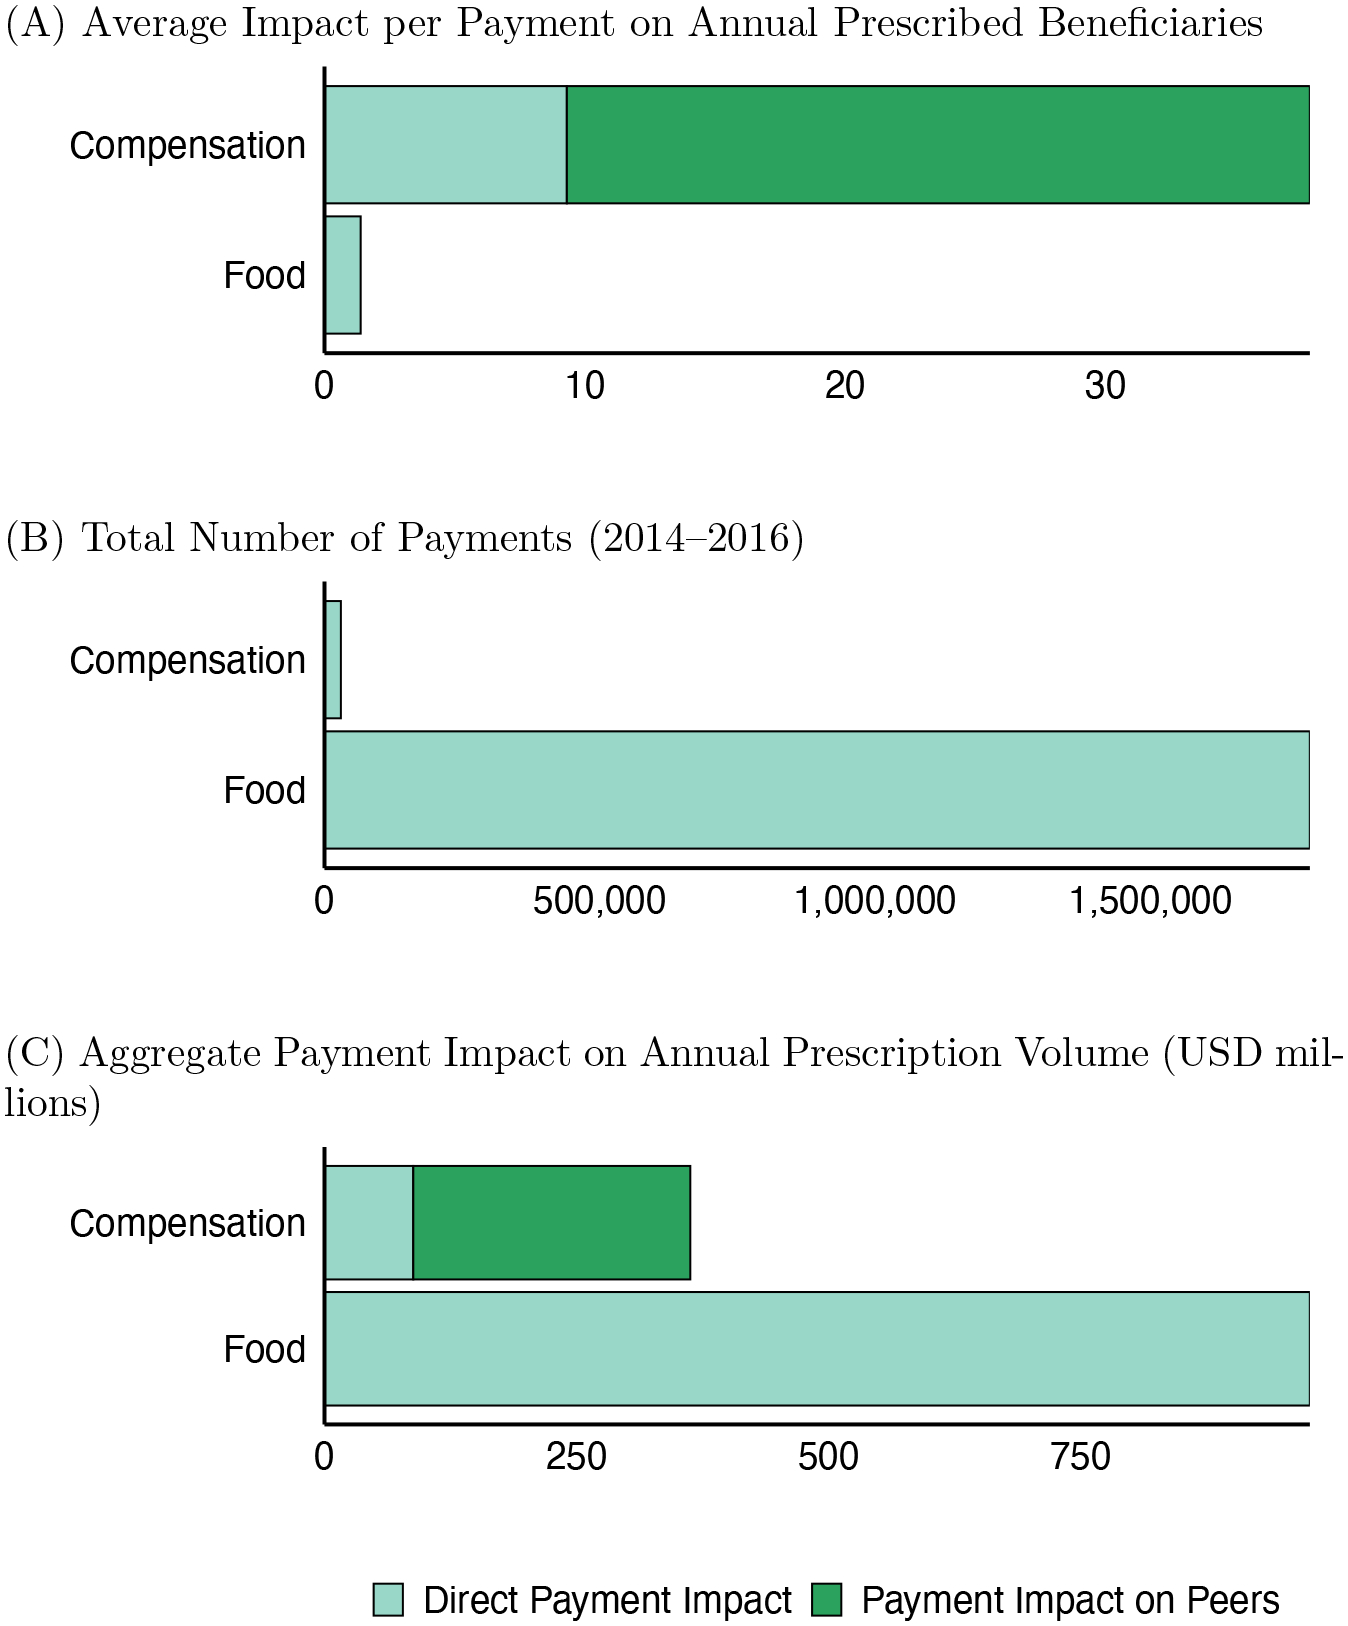
Figure 5:

Pharmaceutical Payment Impact on Prescription Volumes
Notes: Figure shows estimates of direct and peer effects of pharmaceutical payments on prescription volume, by type of payment. Panel (A) shows the estimated effect of a single payment of each type on the annual number of unique beneficiaries prescribed the target drug by the payment recipient (light shade) and by all of the recipient’s peers (dark shade). The impact of peer food payments (− 0.0022, s.e. = 0.0281) is shown as zero. Panel (B) shows the number of pharmaceutical payments and in-kind transfers associated with NOAC drugs in 2014–2016. Panel (C) shows the estimated overall contribution of payments to annual NOAC prescription spending by direct recipients (light shade) and their peers (dark shade) in the United States. To obtain estimates of total spending in US dollars, we multiply the estimated counterfactual number of beneficiaries per quarter with the quarterly average cost of prescriptions of each drug. These average costs are fairly stable over our sample period, as seen in Appendix Figure A4. Panel (A) is based on a 40 percent sample of Medicare Part D beneficiaries; dollar estimates in Panel (C) are annualized and rescaled by a factor of 5.4 to extrapolate to all US prescriptions. This scaling factor is discussed in Section 1. Data sources are described in Section 6. Underlying data are reported in Appendix Table A7.
