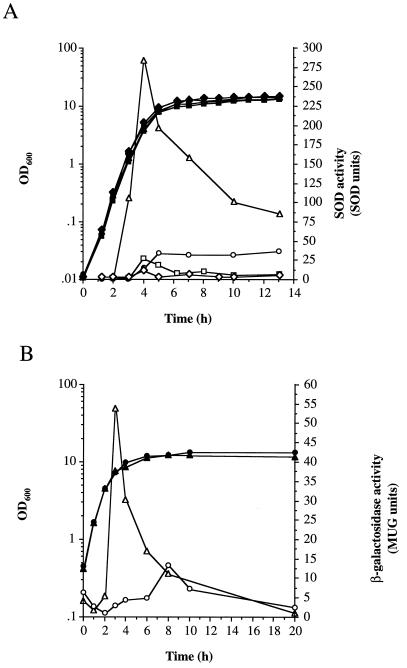
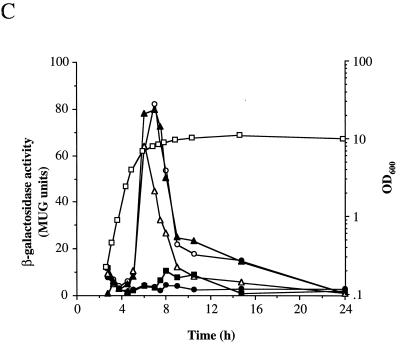
FIG. 3.
SOD activity and expression of sodA during growth and the effect of methyl viologen. (A) Total SOD activity. 8325-4 (○,●,▵,▴,□,■) and SPW1 (⧫,◊) were grown under high (▵,▴,○,●,⧫,◊) or low (□,■) aeration in BHI or in BHI with 10 μM methyl viologen (▵,▴). Closed symbols represent OD600, and open symbols represent SOD activity as described in Materials and Methods. (B) Expression of sodA. SPW1 was grown in BHI with high aeration with (▵,▴) or without (○,●) 10 μM methyl viologen. Growth was measured by OD600 (closed symbols) and β-galactosidase activity (open symbols) as described in Materials and Methods. (C) Effect of growth phase on methyl viologen induction of sodA. Expression of sodA was measured during growth of SPW1 in BHI (●) and in BHI with 10 μM methyl viologen added 0 h (○), 2.75 h (▴), 4.5 h (▵), and 7 h (■) after inoculation. Cells were incubated with high aeration, and expression was measured as described in Materials and Methods. Growth as measured by OD600 is shown for one representative culture (□).


