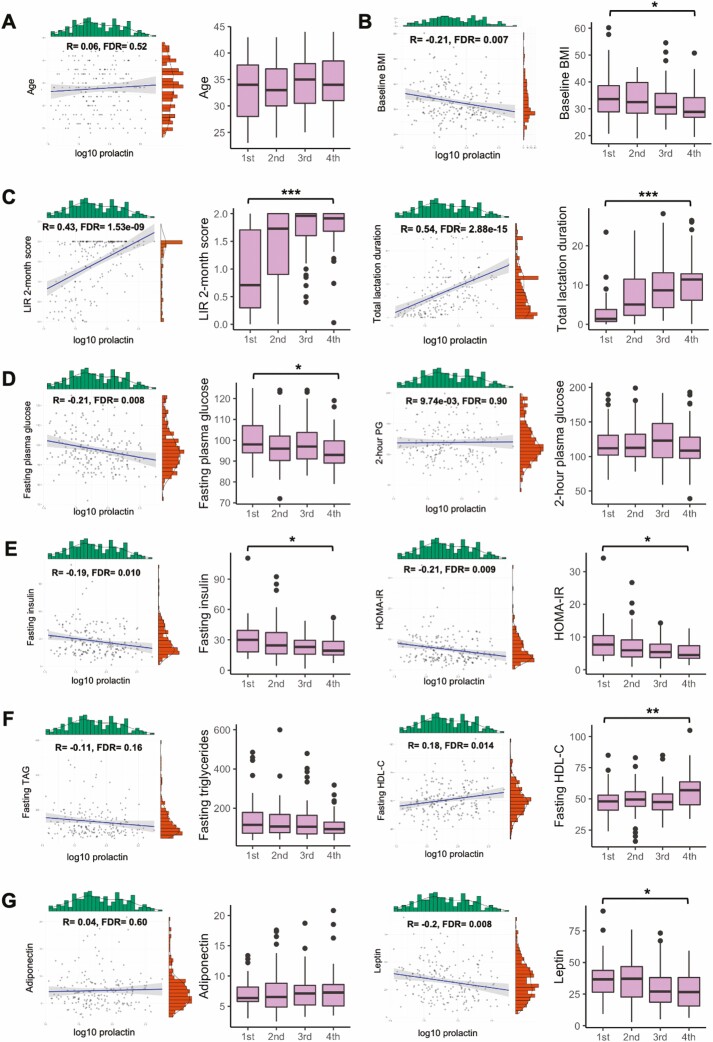
Figure 2.
Correlation analysis of prolactin and research metabolic variables. Correlation between log10 prolactin levels and research metabolic variables; and the distribution of indicated variable within 4 quartiles of prolactin levels (first quartile: ≤34.85 ng/mL, second quartile: >34.85-60.88 ng/mL; third quartile: >60.88-126.24 ng/mL; fourth quartile: >126.24 ng/mL). (A) Age. (B) Baseline BMI. (C) Lactation intensity/duration (LIR 2-month score and total lactation duration). (D) Glucose tolerance variables (Research FPG and 2-hour PG). (E) Insulin resistance variables (fasting insulin and HOMA-IR). (F) Lipids (TAG and HDL-C). (G) Hormones (adiponectin and leptin). *P < 0.05, **P < 0.01, ***P < 0.001. Abbreviations: 2-h PG, 2-hour plasma glucose; BMI, body mass index; FPG, fasting plasma glucose; HDL-C, high-density lipoprotein cholesterol; LIR, lactation intensity/duration ratio; TAG, triglyceride.

