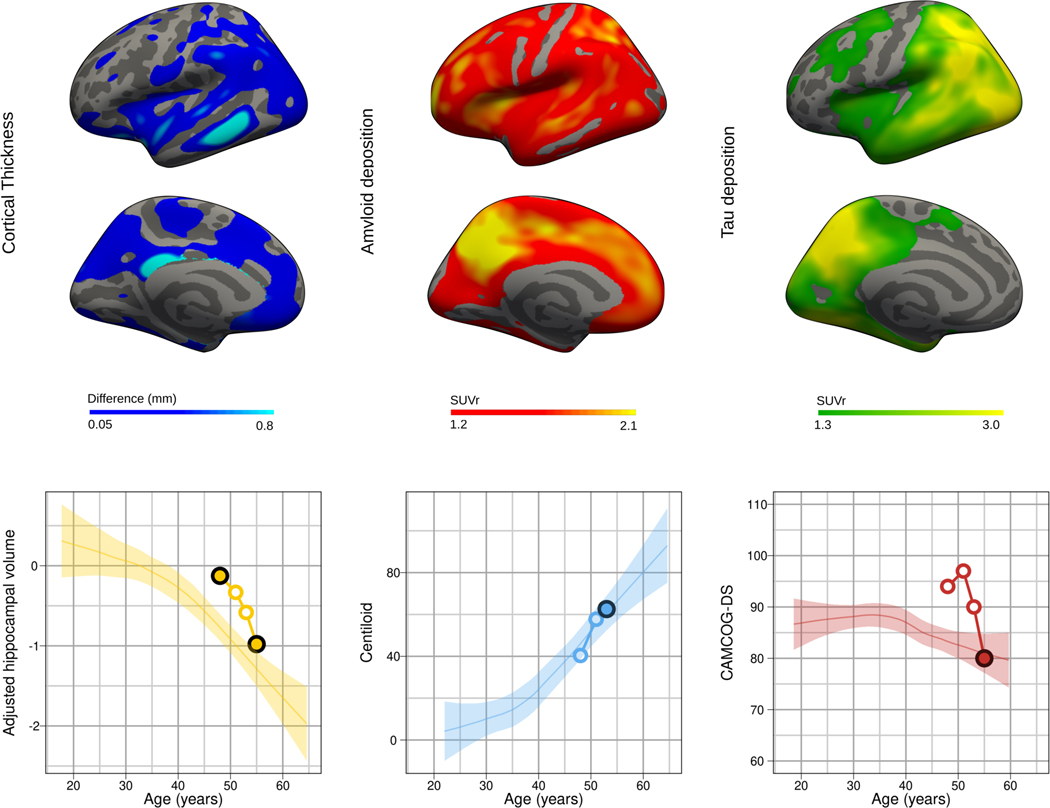
Figure 2. Case study.
The upper row shows the cortical atrophy (difference map between the first and las MRI scan) and both the amyloid and tau PET SUVRs using the Pittsburgh compound B and flortaucipir ligands respectively. The lower row shows the longitudinal intra-individual trajectory of the biomarker changes with respect the described changes with age in Down syndrome as described by Fortea & colleagues.4 The plotted changes with age for the CAMCOG-DS were those described in individuals with mild intellectual disability.44 Coloured dots indicate the different timepoints for assessment and black dots indicate the timepoint in which the displayed neuroimage was performed.

