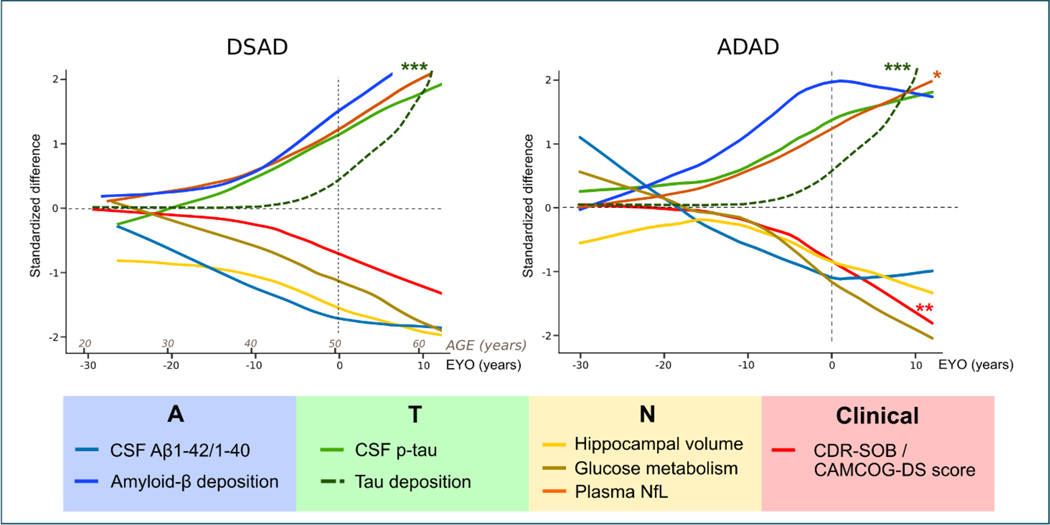
Figure 3: Integrated models of the natural history of Down syndrome-associated Alzheimer’s disease (DSAD) and autosomal dominant Alzheimer’s disease (ADAD).
Comparison of the clinical and biomarker changes (standardised differences) as a function of age in Down syndrome (left) and autosomal dominant Alzheimer’s disease (right).
The DSAD model is based on the study published by Fortea & colleagues4 and includes a hypothetical for tau uptake in PET (***green dotted line) based on the scarce data in Down syndrome.93 The ADAD model is based on that published by Bateman & colleagues.100 We have added the trajectory of plasma neurofilament light based on a large recent study (*orange line),115 and the hypothetical trajectory of Tau deposition measured by Tau-PET (***green dotted line). We have inverted the trajectory of the clinical dementia rating scale sum of boxes (CDR-SOB) to more easily compare the cognitive changes in ADAD and DSAD.

