
FIGURE 3.
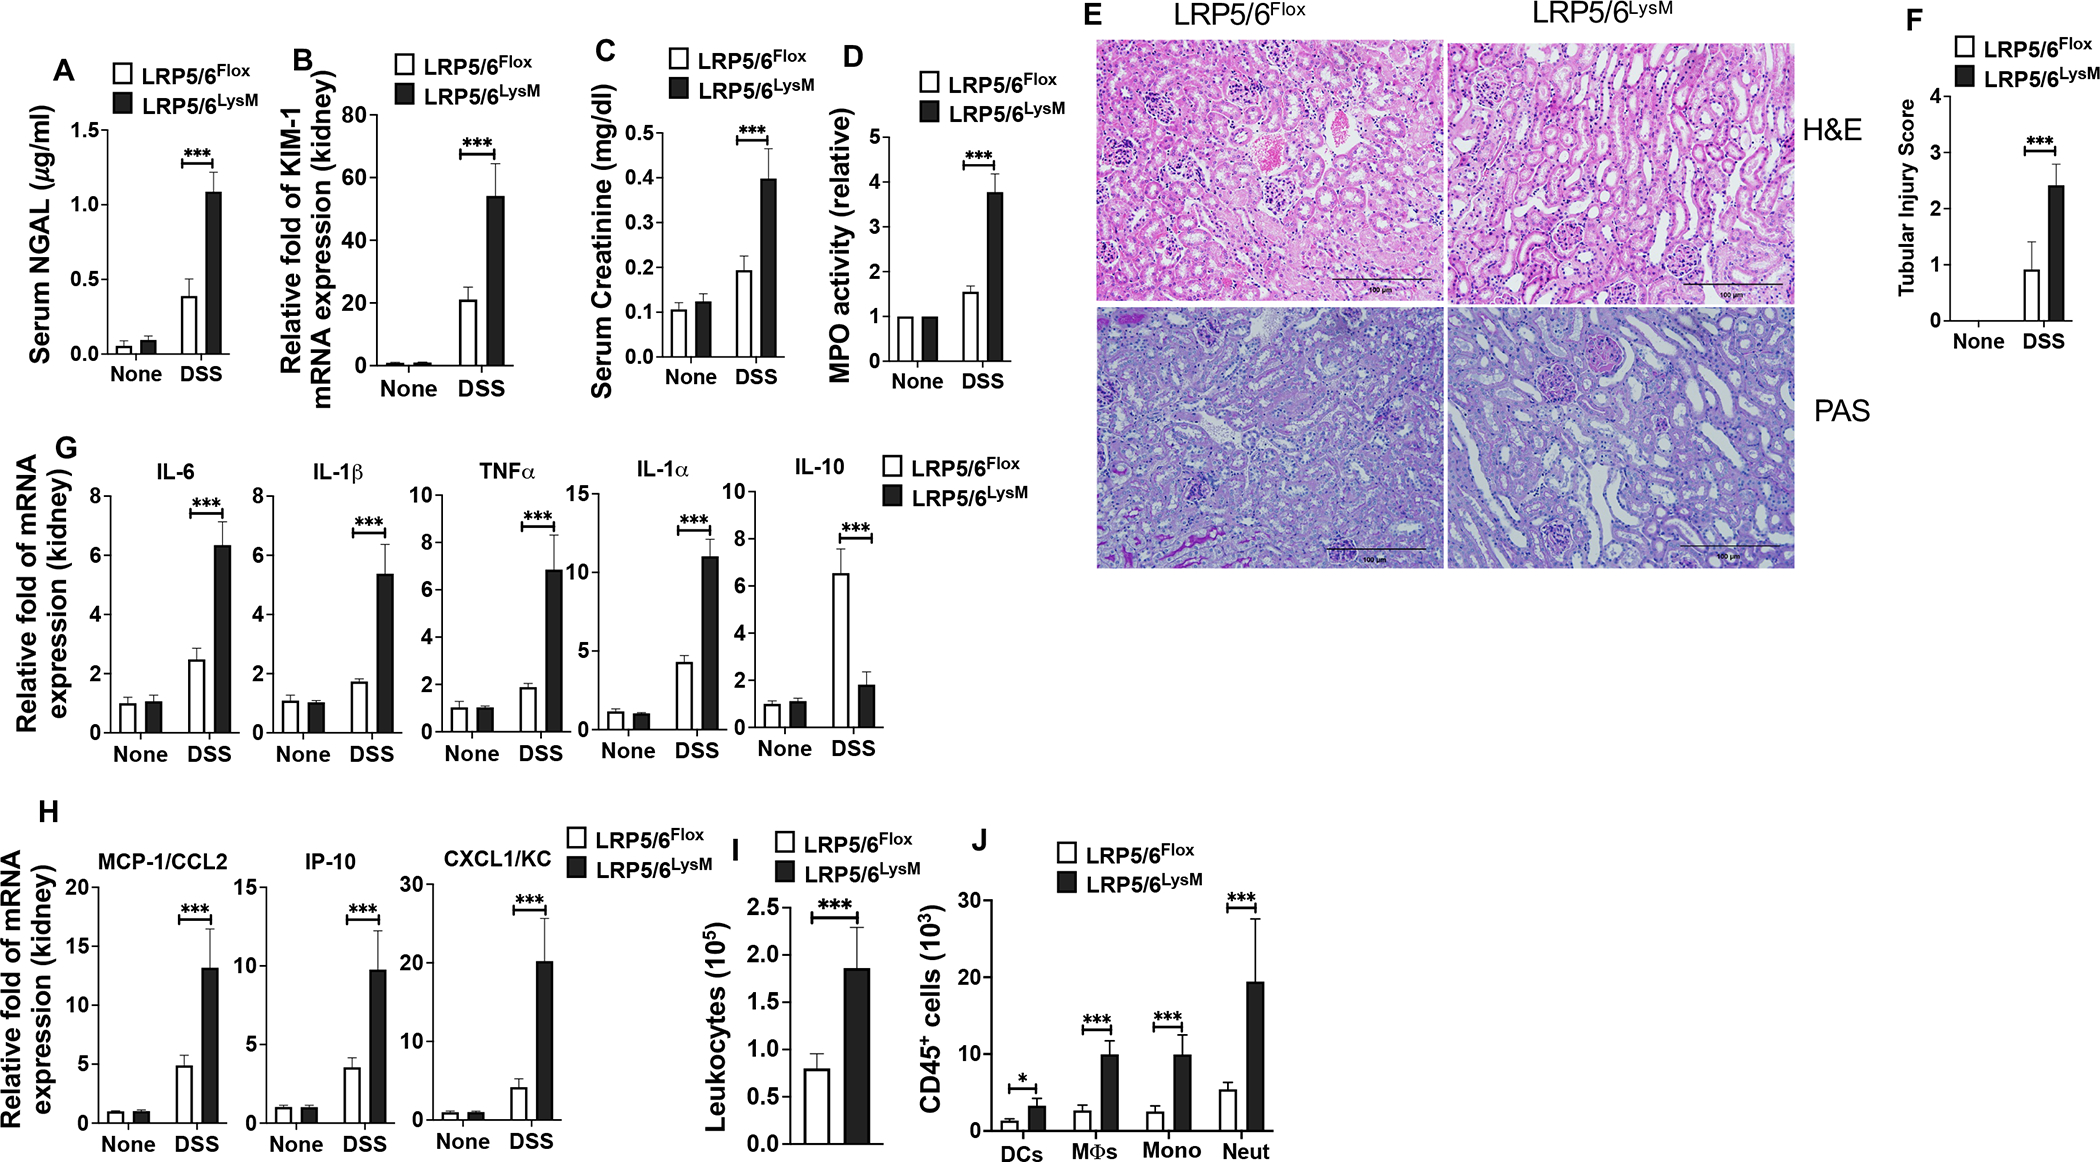
LRP5/6 deficiency in myeloid cells exacerbates DSS-colitis-associated acute kidney injury. (A) Serum NGAL levels, (B) KIM1 mRNA expression in the kidney, (C) serum creatinine levels, and (D) myeloperoxidase (MPO) activity in the kidney of untreated and DSS-treated LRP5/6Flox and LRP5/6LysM mice on day 8. (E) Representative images of H&E- or PAS-stained kidney sections from DSS-treated LRP5/6Flox and LRP5/6LysM mice (Scale bars, 100 μm). H&E- and PAS-stained sections show increased severity of the tubular injury, tubular epithelial vacuolation, dilation of the tubular lumen, and immune cell infiltration in DSS-treated LRP5/6LysM mice. (F) Tubular injury score of kidneys was graded following analysis of H&E- and PAS-stained cross-sections of kidneys of DSS-treated LRP5/6Flox and LRP5/6LysM mice. (G, H) RNA was extracted from kidneys of untreated and DSS-treated LRP5/6Flox and LRP5/6LysM mice. The expression of indicated genes was quantified by qPCR. (I, J) Total number of leukocytes (CD45+), DCs (CD45hi MHC IIhi CD11c+ CD64−), MΦs (CD45hi MHC IIhi CD11c−CD11b+ CD64+), monocytes (CD45hi MHC II− CD11c−CD11b+ Ly6Chi Ly6GLow) and neutrophils (CD45hi MHC II− CD11c−CD11b+ Ly6Clow Ly6Ghi) from the kidney of DSS-treated LRP5/6Flox and LRP5/6LysM mice on day 8 analyzed by flow cytometry. Data is representative of two experiments (n = 4–5 mice per experiment). Error bars show mean values ± SEM. *p<0.05; ***p<0.001.