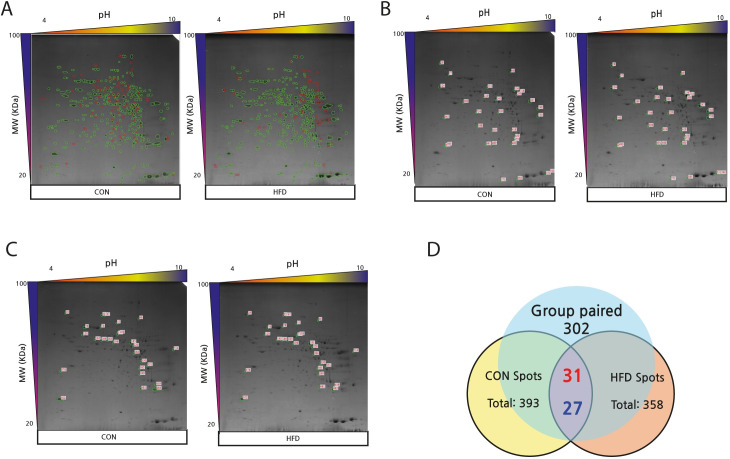
Fig 2.
2D-PAGE images and Venn diagram showing differential protein expression (>2-fold) between CON and HFD groups (A-D). (A) The images of 2D-PAGE show green circles indicating group paired spots, and red circles indicating group non-paired spots. Green circles indicate group paired spots, and orange circles indicate group non-paired spots. The images of the 2D-PAGE show an increase of 31 spots (B) and a decrease of 27 spots (C) among the 302 paired spots in HFD compared to CON. The differentially expressed spots showed a difference of >2.0-fold. (D) The numbers in red denote upregulated spots and the numbers in blue indicate downregulated spots, in the Venn diagram.

