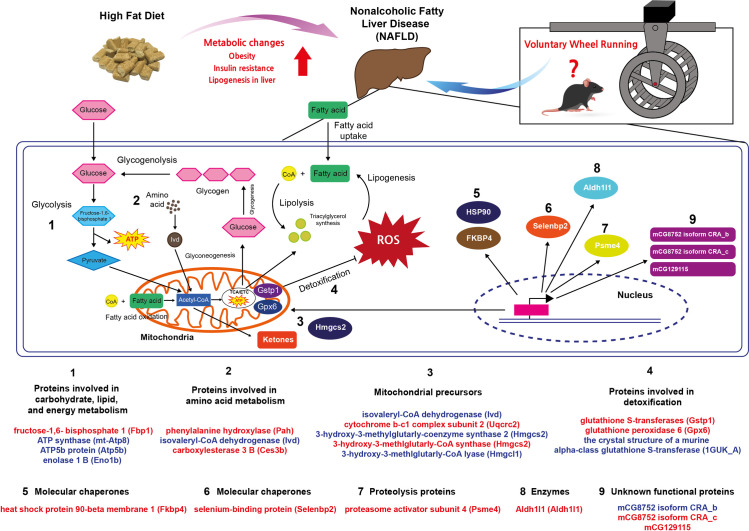
Fig 6. Summary of differentially expressed liver proteins from a high-fat diet and 12 weeks of voluntary wheel running intervention.
Interpretation of proteomic analysis results by LC-MS/MS based on enriched functional annotation of proteins present at higher or lower levels in HFX compared to HFD. Proteins were grouped according to their functional properties into nine categories, as shown in the figure. ATP, adenosine triphosphate; TCA, tricarboxylic acid cycle; ETC, electron transport chain; ROS, reactive oxygen species; CoA, coenzyme A. Red color denotes upregulated protein expression in the HFX group compared to the HFD group and blue color indicates downregulated protein expression in the HFD group compared to the CON group.

