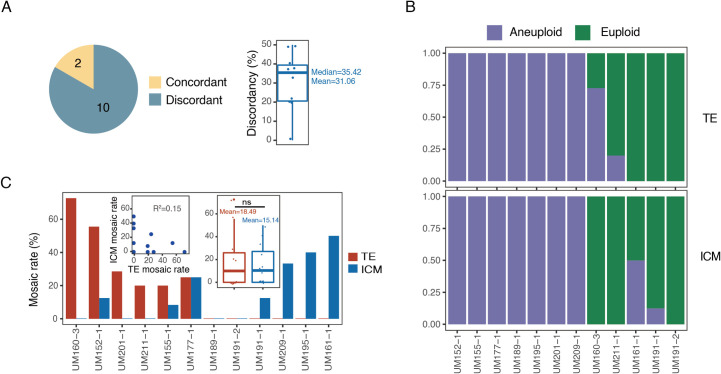
Fig 2. Analysis of chromosome copy number of TE and corresponding ICM from the same embryo.
A) Number of TE-ICM concordant (n = 2) and TE-ICM discordant (n = 10) embryos (left) and the discordancy of the 10 TE-ICM discordant embryos (right). Among the 12 embryos having both TE and ICM cells analyzed, 2 embryos showed the concordant chromosome status and 10 embryos showed discordant chromosome status. Of the 10 TE-ICM discordant embryos, they showed a mean of 31.06% discordancy. n, number of embryos. B) Chromosome status of the matched TE-ICM in each embryo (n = 12). Two (UM160-3, UM211-1) of the 12 embryos had aneuploid TE cells but showed euploid ICM cells. Another two (UM161-1, UM191-1) embryos showed euploid TE cells but had aneuploidy ICM cells. n, number of embryos. C) Mosaic rates of the matched TE-ICM in each embryo (n = 12). The barplot showed the mosaic rates of TE and ICM from 12 embryos with both TE and ICM cells. The left insert dotplot showed the relation between the mosaic rate of TE and matched ICM. The right insert boxplot showed the mosaic rates of TE and matched ICM. n, number of embryos.

