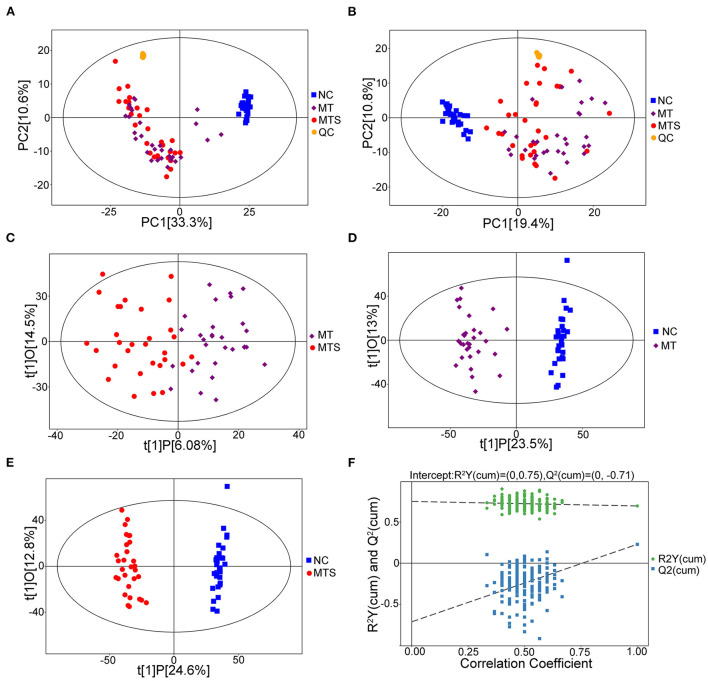
Figure 2.
Metabolic profiles of plasma samples of NC, MT and MTS. (A) PCA score plots of the samples derived from the metabolite profiles in the ESI+ model, QC: quality control. (B) PCA score plots of the samples derived from the metabolite profiles in the ESI- model. (C) OPLS-DA score scatter plots of plasma samples of MTS vs. MT derived from the metabolite profiles in the ESI+ model. (D) OPLS-DA score scatter plots of plasma samples of MT vs. NC derived from the metabolite profiles in the ESI+ model. (E) OPLS-DA score scatter plots of plasma samples of MTS vs. NC derived from the metabolite profiles in the ESI+ model. (F) Permutation test of the OPLS-DA model for MTS vs. MT in the ESI+ model. N = 30 in each group. (A–F) were drawn by R version 4.0.2.

