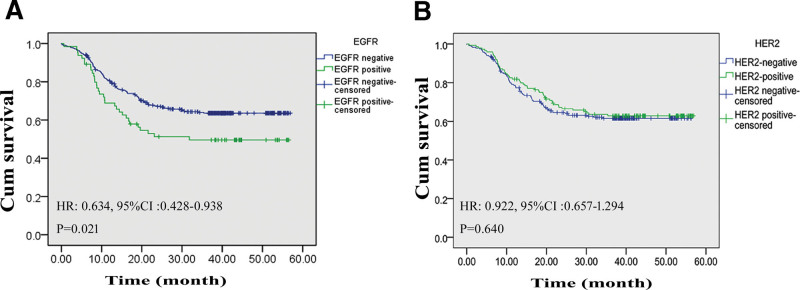
Figure 3.
Survival difference according to the expression levels of EGFR. (A) Survival curve of patients with EGFR-positive GC or with EGFR-negative GC. (B) Survival curve of patients with HER-2-positive or with HER2-negative GC. 95% CI = 95% confidence interval, EGFR = epidermal growth factor receptor, GC = gastric cancer, HER-2 = human epidermal growth factor receptor-2, HR = hazard ratio.

