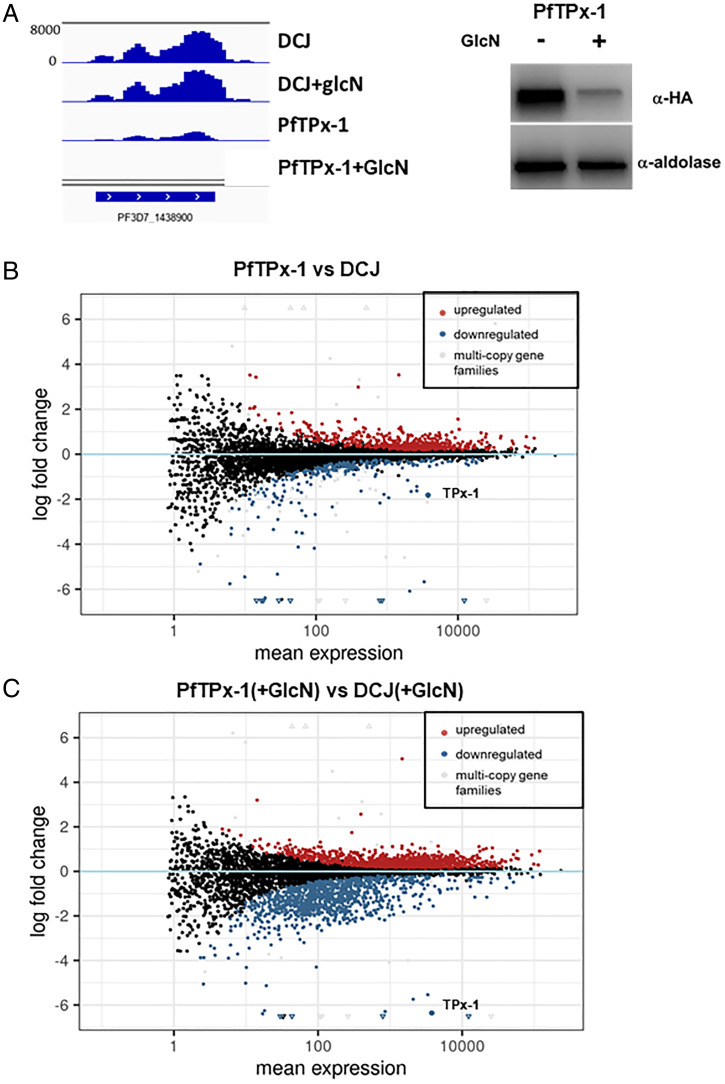
Fig. 8.
PfTPx-1 knockdown causes transcriptional changes of several gene subsets. (A) Expression profile for the PfTPx-1 transcript (PF3D7_1438900) (bedgraph coverage illustration of relative expression from IGV) showing the knockdown of the PfTPx-1 in the transgenic line compared to the parent DC-J line. Western blot analysis demonstrating the reduction of PfTPx-1 protein levels in the transgenic lines are shown on the right. (B and C) MAplots of PfTPx-1HAglmS vs. DC-J control without (B) and with GlcN (C), show genes that are differentially regulated upon down-regulation of PfTPx-1 with GlcN. Within the plots, black dots represent nonsignificant genes. Significantly up-regulated and down-regulated genes (Padj < 0.05) are shown in red and blue, respectively. Significantly changed genes of the multicopy gene families are shown in gray. Triangles are used to represent values that are beyond the axes limit.

