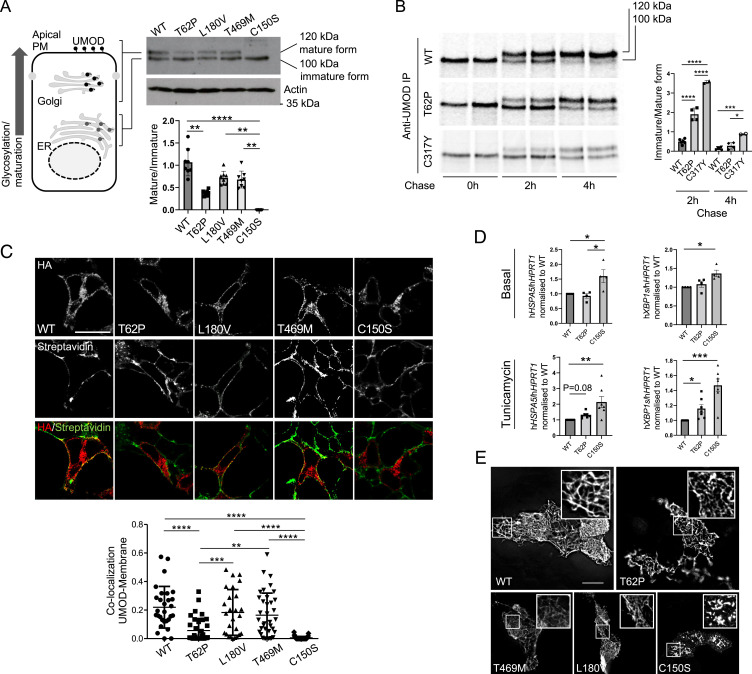
Fig. 2.
p.Thr62Pro substitution induces intermediate UMOD trafficking and maturation defect. (A) Western blot analysis of UMOD expression in HEK293 cells 6 h after transfection of the indicated UMOD isoforms. Actin is shown as a loading control. The graph represents the ratio of Golgi glycosylated form (mature) to ER glycosylated form (immature). Bars indicate mean ± SD. n = 8 independent experiments. **P < 0.01 using the Kruskal–Wallis test (P < 0.0001) followed by Dunn’s multiple comparison test; ****P < 0.0001 using the Kruskal–Wallis test (P < 0.0001) followed by Dunn’s multiple comparison test. (B) Pulse chase experiments performed in HEK293 cells stably expressing the indicated UMOD isoform. The maturation to fully glycosylated protein is delayed for the p.Thr62Pro isoform compared with the wild-type (WT) one, but it is more efficient than the one observed for the p.Cys317Tyr mutant. Bars indicate the mean ± SD of the ratio of immature to mature form. n = 6, 4, and 2 for WT, p.Thr62Pro, and p.Cys317Tyr, respectively. *P < 0.05 using one-way ANOVA (P < 0.0001) followed by Bonferroni’s multiple comparison test; ***P < 0.001 using one-way ANOVA (P < 0.0001) followed by Bonferroni’s multiple comparison test; ****P < 0.0001 using one-way ANOVA (P < 0.0001) followed by Bonferroni’s multiple comparison test. IP, immunoprecipitation (C) Immunofluorescence analysis of HEK293 cells 10 h after transfection with the indicated UMOD isoform. UMOD is seen in red (stained with HA), and the plasma membrane (PM) is in green (stained with streptavidin-FITC after biotinylation) in the merged picture. The graph reports the Mander’s 2 coefficient as a readout for UMOD at the PM. The mean ± SD is indicated. (Scale bar, 10 µm.) **P < 0.01 using one-way ANOVA (P < 0.0001) followed by Bonferroni’s multiple comparison test; ***P < 0.001 using one-way ANOVA (P < 0.0001) followed by Bonferroni’s multiple comparison test; ****P < 0.0001 using one-way ANOVA (P < 0.0001) followed by Bonferroni’s multiple comparison test. HA, hemagglutinin; FITC, fluorescein isothiocyanate. (D) GRP78 (HSPA5) and spliced XBP1 (XBP1s) expression assessed by real-time qPCR in HEK293 cells expressing the indicated UMOD isoform in the basal condition (Upper) or after 12 h of treatment with a low dose of tunicamycin (Lower). Expression is normalized to HPRT1, and bars indicate mean ± SEM. *P < 0.05 using the Kruskal–Wallis test (baseline: P = 0.009 HSPA5, P = 0.003 XBP1s; tunicamycin: P = 0.0009 HSPA5, P < 0.0001 XBP1s) followed by Dunn’s multiple comparison test (n = 4 to 7 independent experiments); **P < 0.01 using the Kruskal–Wallis test (baseline: P = 0.009 HSPA5, P = 0.003 XBP1s; tunicamycin: P = 0.0009 HSPA5, P < 0.0001 XBP1s) followed by Dunn’s multiple comparison test (n = 4 to 7 independent experiments); ***P < 0.001 using the Kruskal–Wallis test (baseline: P = 0.009 HSPA5, P = 0.003 XBP1s; tunicamycin: P = 0.0009 HSPA5, P < 0.0001 XBP1s) followed by Dunn’s multiple comparison test (n = 4 to 7 independent experiments). (E) Immunofluorescence analysis of unpermeabilized MDCK cells stably showing the indicated UMOD isoform at the PM. Insets show UMOD polymers at higher magnification. All the analyzed variants form polymers on the PM, while the pathogenic ADTKD mutant p.Cys150Ser forms aggregates. (Scale bar, 10 µm.)

