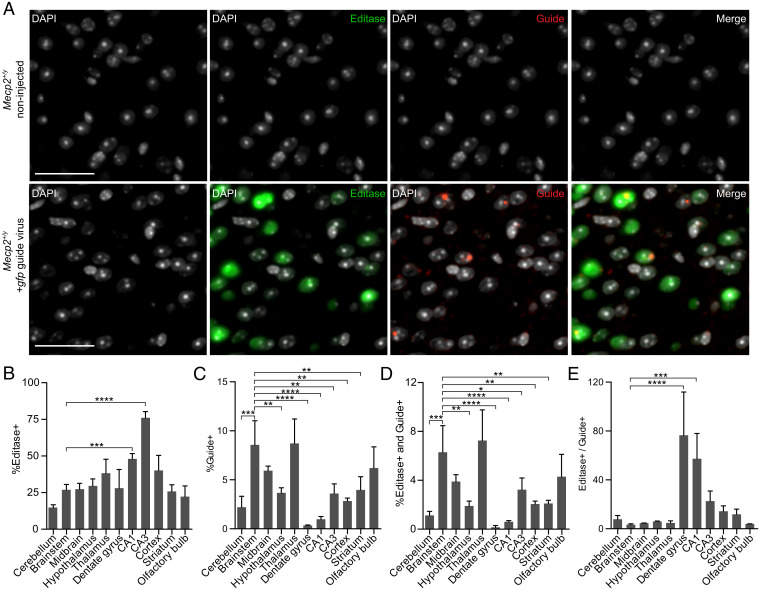
Fig. 6.
Multiplex BaseScope detection of cells expressing Editasewt and guide RNA across brain regions. (A) Representative images from the brainstem of a noninjected male Mecp2+/y mouse (Upper) and an Mecp2+/y mouse injected with the gfp guide virus (Lower). DAPI marks nuclei. (Scale bars, 50 µm.) (B–E) Percentages corresponding to Mecp2+/y mice injected with the gfp guide virus; n = 3 mice. (B) Percentage of cells expressing Editasewt. (C) Percentage of cells expressing gfp guide RNA. (D) Percentage of cells expressing both Editasewt and guide RNA. (E) Ratio of Editase+ to guide+ cells. The percentage (mean ± SD) of cells in each brain region is relative to the total number of DAPI+ cells. Total cells counted in each region are found in SI Appendix, Fig. S4. *P < 0.05, **P < 0.01, ***P < 0.001, ****P < 0.0001. All comparisons lacking asterisks were not significant. Statistics were determined using a one-way ANOVA relative to brainstem values.

