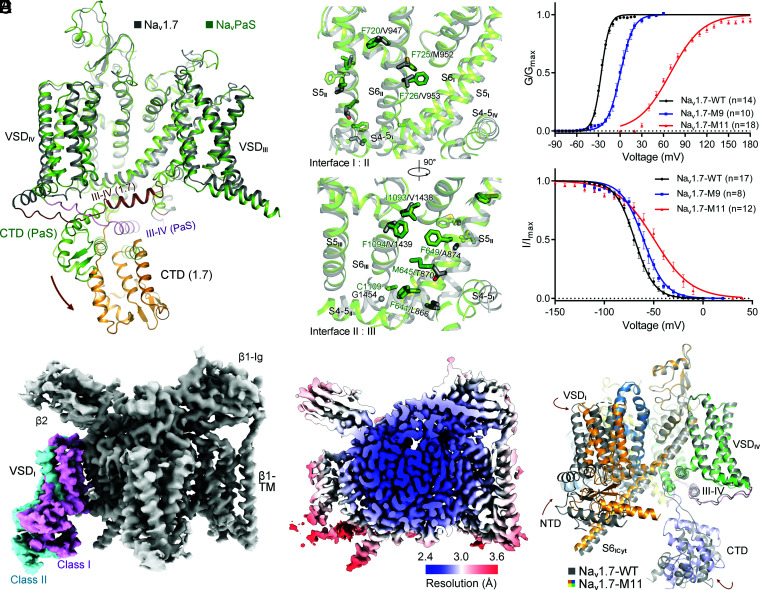
Fig. 1.
A rationally designed Nav1.7 variant with right-shifted voltage-dependence for activation and inactivation displays marked conformational shifts from the WT channel. (A) Distinct conformations of WT human Nav1.7 and NavPaS. Shown here is a side view of the superimposed α subunit of Nav1.7 and NavPaS (PDB ID codes: 7W9K and 6A95, respectively). The brown arrow indicates the swing of the carboxy terminal domain (CTD) from NavPaS to Nav1.7. (B) Structure-guided introduction of mutations that may strengthen the interactions between adjacent repeats in the PD of Nav1.7. Nine small residues on S5II, S6II, and S6III in Nav1.7 are replaced by the corresponding ones in NavPaS, which contains more bulky residues on the interface of adjacent repeats. The Nav1.7 variant containing L866F, T870M, A874F, V947F, M952F, V953F, V1438I, V1439F, and G1454C is designated Nav1.7-M9. (C) Right shift of both activation and inactivation curves of Nav1.7 variants. V1/2 of the activation curve for Nav1.7-M9 is shifted from −26.02 ± 0.24 mV to 0.55 ± 0.43 mV, and that of the inactivation curve changes from −69.21 ± 0.37 mV to −60.40 ± 0.56 mV. Two additional mutations, E156K on S2I and G779R on S2II, led to a pronounced right shift of the activation threshold with the V1/2 reaching 69.37 ± 0.80 mV. This variant, designated Nav1.7-M11, was applied for cryo-EM structural analysis. Data points are presented as mean ± SEM and n is the number of recorded cells. Statistical significance was assessed using one-way ANOVA analysis. (D) Two distinct conformations of VSDI were observed in the 3D EM reconstructions of Nav1.7-M11. For simplicity, the label Nav1.7-M11 or M11 refers to class I hereafter, unless otherwise indicated. (E) Heat map for resolution distribution of M11. Local resolutions were calculated in RELION 3.0. (F) Overall structural shifts between M11 and WT. Shown here is a side view of the superimposed structures. Structures of the β1 and β2 subunits are omitted in all structure figures. The brown arrows indicate the conformational shifts from WT (gray) to M11 (domain colored). Movies S1–S4 illustrate the conformational changes presented in different figures. Maps were prepared in Chimera (48) and structure figures were prepared in PyMol (49).

