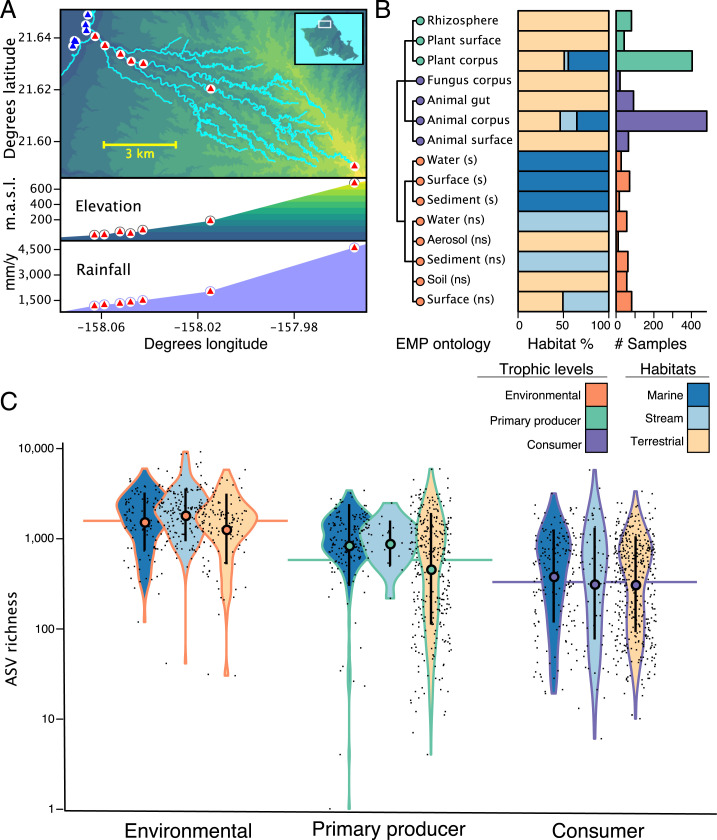
Fig. 1.
Sampling within the Waimea watershed on Oʻahu Island. (A) Terrestrial and stream samples were paired and spanned the entirety of the catchment. Plot positions (n = 21) along elevation and rainfall gradient are indicated with triangles (blue triangles are marine, red triangles are terrestrial/stream). “m.a.s.l.” indicates meters above sea level. (B) Distribution of n = 1,562 samples. Samples are classified at level 3 of the EMP metadata ontology. Stacked barchart colors indicate habitat of origin. Histogram colors indicate environmental/trophic status of sample; “ns” indicates nonsaline, “s” indicates saline. (C) Violin plots indicate distributions of ASV richness organized by trophic level (outline) and habitat (fill). Microbial richness tracks environmental/trophic position of the sample. Circles are median, vertical lines indicate the interquartile range, and horizontal lines indicate the mean. Mean richness of environmental/trophic levels differ significantly (ANOVA, F = 173.9, P < 0.0001).

