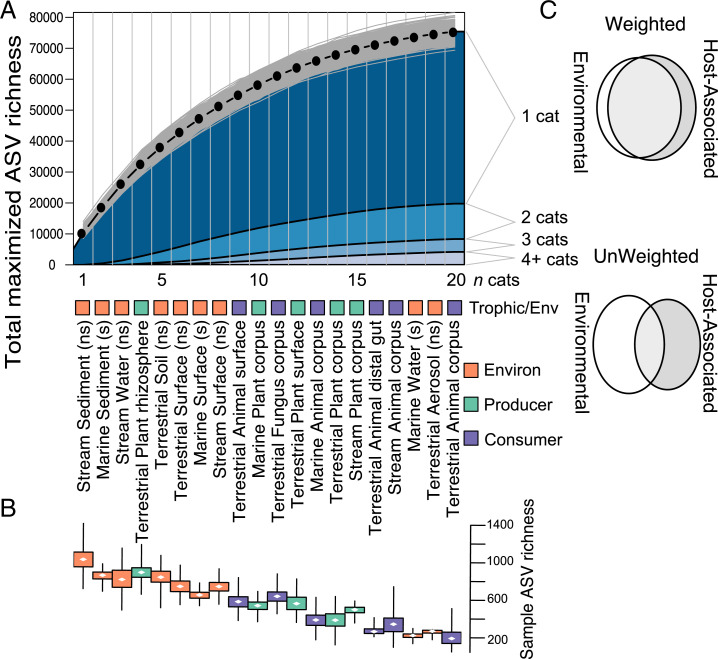
Fig. 2.
Environmental samples contribute the most to novel diversity of the watershed microbiome. (A) Accumulation curve of ASV richness maximized for n sample type:habitat categories. For a given n, black dots represent the average ASV richness for the optimized collection of n categories, given 1,000 randomizations (gray lines). Labels indicate the rankings of categories by their contribution to maximized richness. Colored box indicates environment/trophic level. “ns” indicates nonsaline, “s” indicates saline. (B) Boxplots show median, interquartile range, and data extent of ASV richness across randomizations. (C) Euler diagrams that depict the overlap of environmental and host-associated ASV diversity in cases where the ASVs are weighted by their numerical abundance in the dataset and not.

