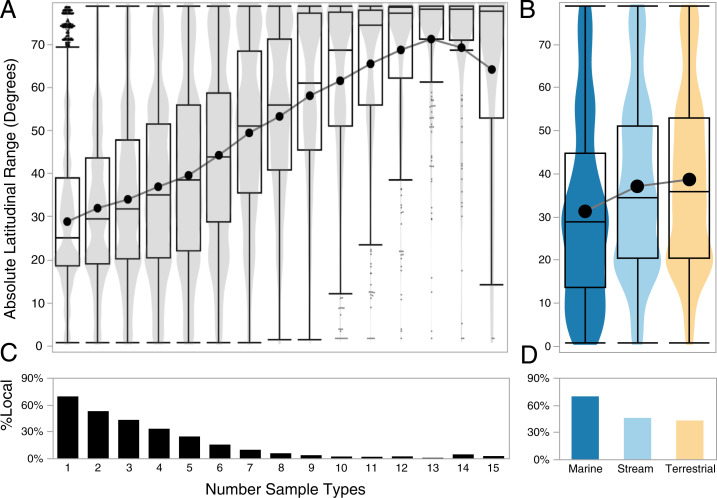
Fig. 4.
Local sample breadth predicts global distributions of microbes. (A) Violin contour densities of latitudinal range in the EMP dataset, binned by the number of EMPO 3 categories in which ASVs occur in Hawaiʻi. Data depicts all ASVs found in both the Hawaiʻi and EMP datasets (n = 116,507). Quantile box plots are overlaid as in Fig. 2) The line tracks the mean. (B) Histograms indicate the proportion of ASVs from the combined dataset (n = 1,911,880) unique to the Hawaiʻi dataset (local) as a function of EMPO 3 category breadth. (C) Latitudinal ranges of ASVs differed significantly by habitat (ANOVA F = 1,279, P > 0.0001, Tukey post hoc all pairs P < 0.0001). (D) Marine samples contained the highest percentage of local ASVs.

