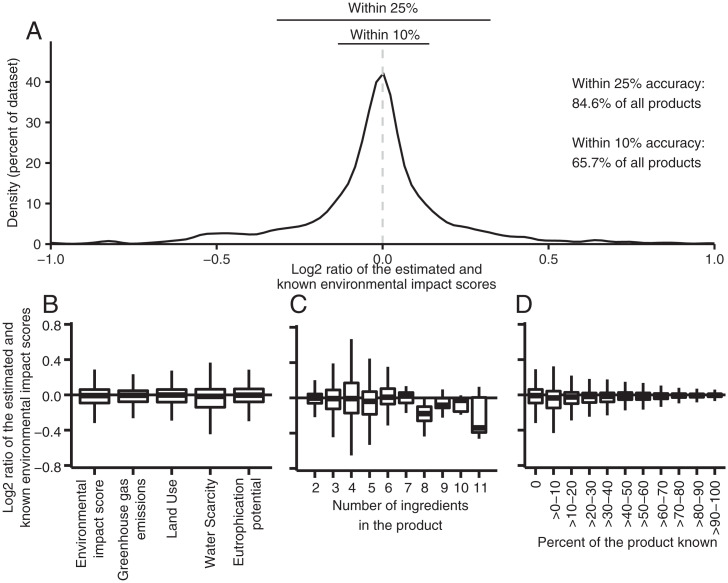
Fig. 2.
Accuracy of estimated environmental impact scores. Panels show (A) the distribution of the accuracy when the percent composition of no ingredients is known, how accuracy varies with (B) the number of similar products when the composition of no ingredients is known, (C) the number of ingredients in the product when the percent composition of no ingredients is known, and (D) the percentage of the product’s ingredient composition is known. In (A) the x-axis is cut off at −50% and 50% for visibility; an additional 31 data points outside these limits, or 2.0% of the data sample, are available in SI Appendix, Dataset S3. Accuracy is the difference between the known and estimated environmental impact score (in percent), and is calculated as estimated environmental impact score/(known environmental impact score – estimated environmental impact score). The known environmental impact score is calculated using information in the ingredient list, while the estimated environmental impact score is calculated using randomly selected subsets of composition information for each product. Boxplots in B–D indicate, from bottom to top, the 25th percentile – 1.5*IQR (interquartile range), 25th percentile, median, 75th percentile, and 75th percentile + 1.5*IQR.

