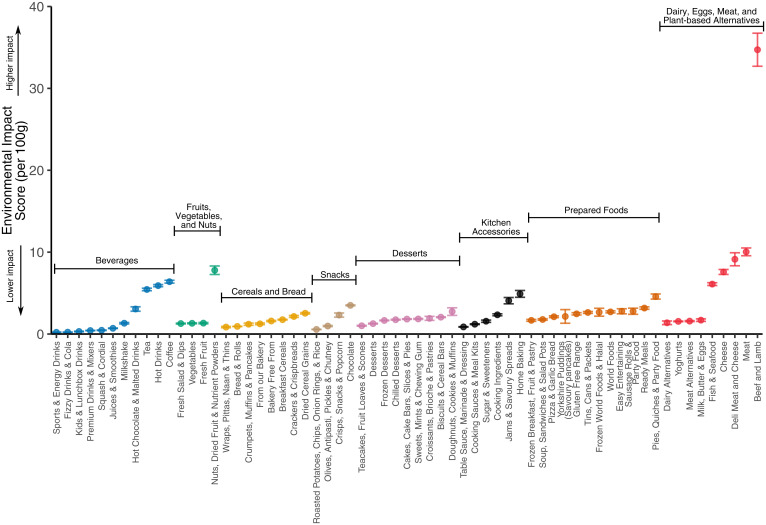
Fig. 3.
Environmental impact scores per 100 g of products in Tesco Aisles. Points indicates mean impact of all products categorized to the Aisle, and error bars indicate ±1 SEM. Aisles are colored by food type. Food types are shown from lowest median environmental impact on the left to highest median environmental impact at the right. Aisles within food types are ordered from lowest to highest mean environmental impact score. When plotting, Aisles containing similar products were condensed for visibility and clarity (see SI Appendix, Supplementary Information Text ). For instance, the Aisles “Fresh Vegetables” and “Frozen Vegetables” were condensed into “Vegetables.”

