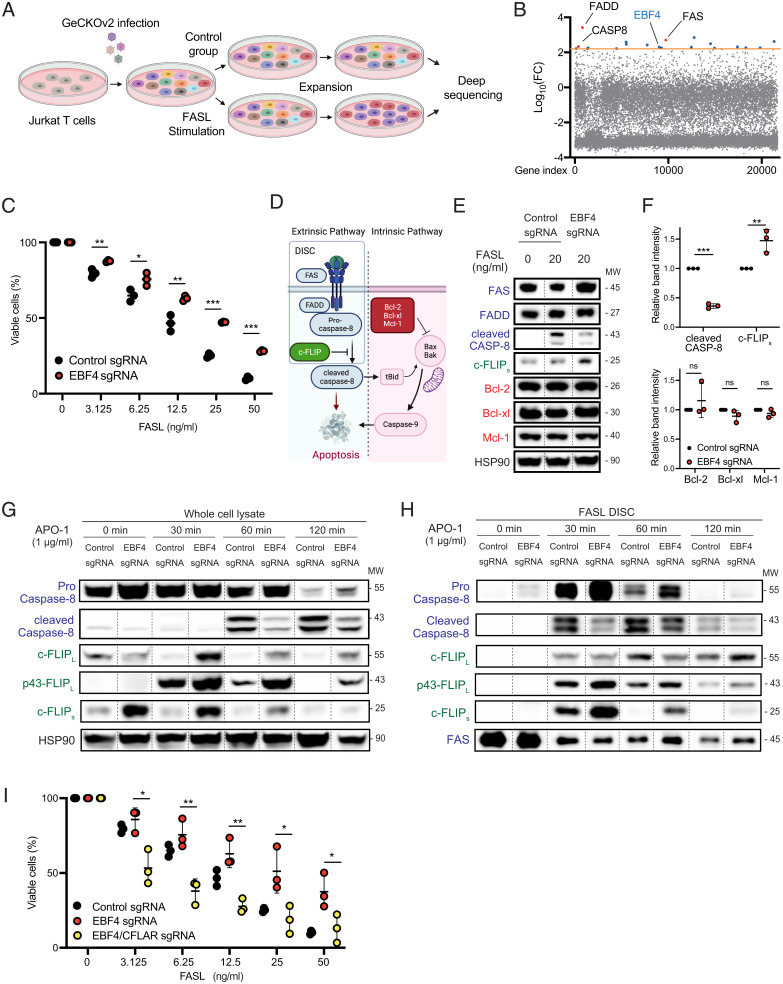
Fig. 1.
The whole-genome CRISPR screen shows that EBF4 KO attenuates Fas-induced apoptosis. (A) Scheme of whole-genome CRISPR screen to identify genes whose deletion causes resistance to Fas-induced apoptosis. (B) Graph of log10- FC difference vs. gene index from DNA samples after Fas stimulation compared to unstimulated cells. The orange line denotes the significance cutoff of our CRISPR screen. (C) The percentage of viable WT and EBF4 KO Jurkat T cells after different concentrations of FASL stimulation. (D) Scheme of Fas-mediated apoptosis. (E) Immunoblot of key Fas canonical regulators with or without stimulation with FasL for 4 h. Lanes have been rearranged along dashed lines but sourced from the same gel, membrane, and exposure time. (F) Intensity of immunoblot bands of cleaved caspase-8, c-FLIPs, Bcl-2, Bcl-xl, and Mcl-1 following FasL stimulation relative to HSP90 loading control. (G) Immunoblot of Fas canonical regulators following stimulation with 1 μg/mL APO-1 to APO-3 for 0 to 120 min. Lanes have been rearranged along dashed lines but sourced from the same gel, membrane, and exposure time. (H) CD95-immunoprecipitation was performed, and immunoprecipitated members of the DISC were analyzed with the same condition in G. Lanes have been rearranged along dashed lines but sourced from the same gel, membrane, and exposure time. (I) The percentage of viable EBF4 KO and EBF4 CFLAR double-KO cells compared to WT following FASL from experiments represented in C. All experiments are representative of at least three independent experiments with similar findings. Two-way comparisons were calculated using a two-tailed, unpaired Student’s t test. MW, Molecular weight; *P ≤ 0.05, **P ≤ 0.01, and ***P ≤ 0.001.

