Fig. 4.
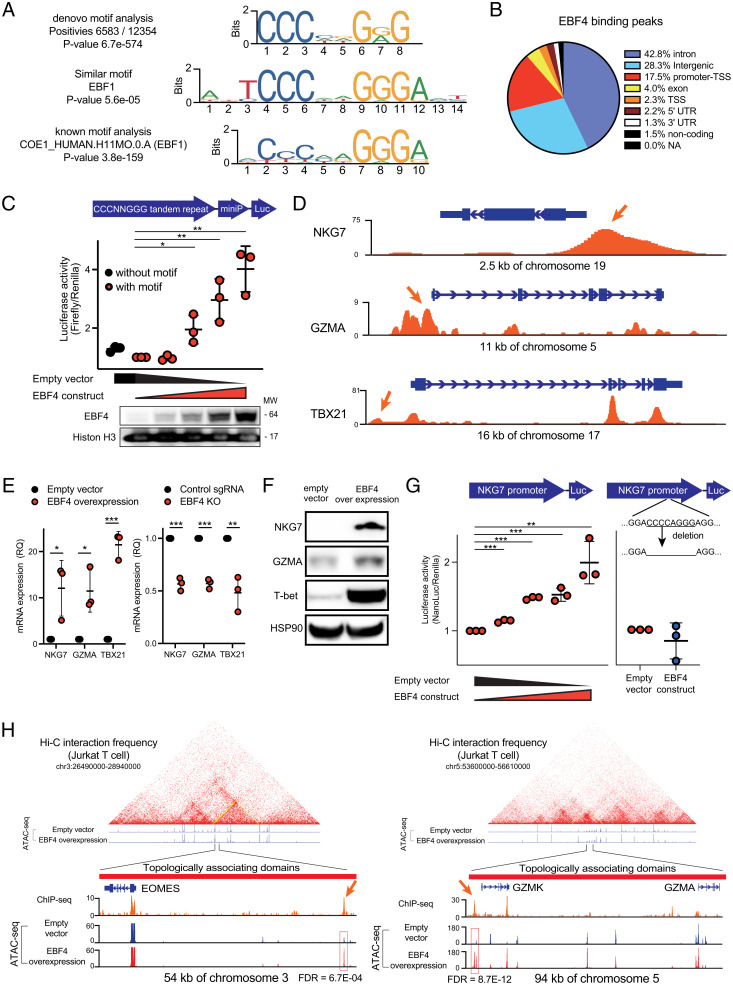
ChIP-seq and ATAC-seq analysis reveal which regions of DNA bind EBF4. (A) The EBF4 binding motif revealed by ChIP-seq. Top: most significant De novo motif identified in peaks; Middle: known transcription factor binding motif most like the De novo motif; Bottom: known transcription factor binding motif most significantly enriched in peaks. (B) Genomic features associated with EBF4 binding sites. (C) Luciferase assay of CCCAGGGG 5 tandem repeats transfected in 293 T cells. Bottom: immunoblot of EBF4 in the nucleus. (D) ChIP-seq tracks from FLAG-tagged EBF4 Jurkat T cells for the NKG7, GZMA, and TBX21 loci normalized by input. (E) mRNA expression of NKG7, GZMA, and TBX21 quantified by RT-qPCR in Jurkat cells for EBF4 OE vs. control (Left) and control vs. EBF4 KO (Right). (F) Immunoblot of protein levels of NKG7, TBX21, and GZMA. Data from NKG7 and HSP90 are sourced from a different blot than GZMA and T-bet. (G) Luciferase assay of NKG7 promoter region without deletion of CCCAGGGG (Left) or with deletion (Right) transfected in 293 T cells. (H) ATAC-seq tracks from WT and EBF4 OE Jurkat T cells for the EOMES and GZMK/GZMA loci and their topologically associating domains. ChIP-seq tracks are also shown from experiments represented in (D). FDR = false discovery rate. All experiments are representative of at least three independent experiments with similar findings. Two-way comparisons were calculated using a two-tailed, unpaired Student’s t test. MW, Molecular weight; miniP, Minimal promoter; RQ, relative quantification; T-bet, T box expressed in T cells. *P ≤ 0.05, **P ≤ 0.01, and ***P ≤ 0.001.

