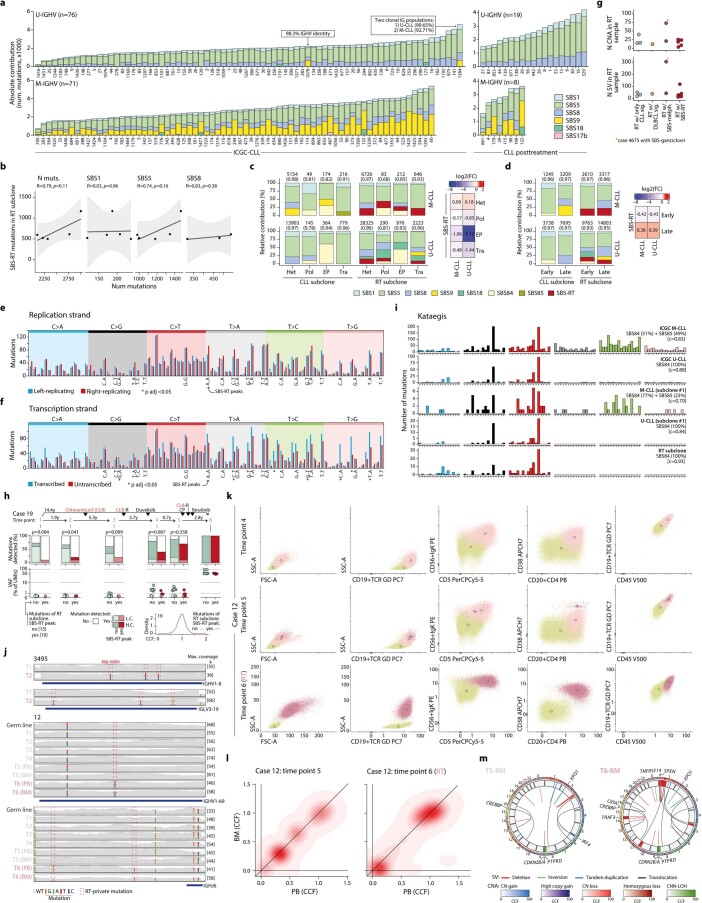
Extended Data Fig. 5. Fitting of mutational signatures, characterization of SBS-RT, and co-occurrence of RT subclones.
a. Mutational processes in ICGC-CLL (left) and post-treatment CLL (right) cohorts. b. Correlation of SBS-RT with the total number of SNVs and other mutational processes in RT subclones. Gray area, 95% confidence interval. c. Activity of the mutational processes identified in regulatory regions of the genome: heterochromatin (Het), polycomb (Pol), enhancer/promoter (EP), and transcription (Tra). The heat map (right) shows the log2-fold change of the observed vs expected number of SBS-RT mutations/region. d. Contribution of the mutational processes in early/late replication regions. e-f. Replication (e) and transcriptional (f) strand bias of the mutational profile of RT subclones with SBS-RT. The main peaks of the SBS-RT are indicated with their context on the x-axis. Significant asymmetries are indicated with asterisks (exact p values are listed in Supplementary Table 16). g. Number of CNAs and SVs in RT samples. h. Detection (top) and variant allele frequency (VAF) (bottom) of mutations assigned to the RT subclone during the disease course in patient 19 based on UMI-based NGS. Mutations are grouped according to the main peaks of SBS-RT. P values by Fisher’s test. L.C., low confidence; H.C., high confidence. Density plot showing the distribution of the cancer cell fraction (CCF) of the SNVs assigned to the RT subclone by WGS (bottom right). i. Mutational profiles of kataegis in ICGC-CLL samples (row 1–2), CLL subclones from the present CLL/RT cohort (row 3–4), and RT subclones (all U-CLL) (row 5). Mutational processes identified are indicated together with its contribution and cosine similarity to the reconstructed profile. j. Immunoglobulin genes of two cases harboring RT-specific SNVs at time of RT (time points, T, highlighted in rose). PB, peripheral blood. BM, bone marrow. k. Complete flow cytometry analysis in case 12. Numbers along axes are divided by 1000. l. Density plot showing the comparison of the CCF of the SNVs of synchronous BM and PB samples analyzed in patient 12. m. Circos plots of the BM samples of patient 12 for comparison with the rearrangements observed at PB (Supplementary Fig. 1).

