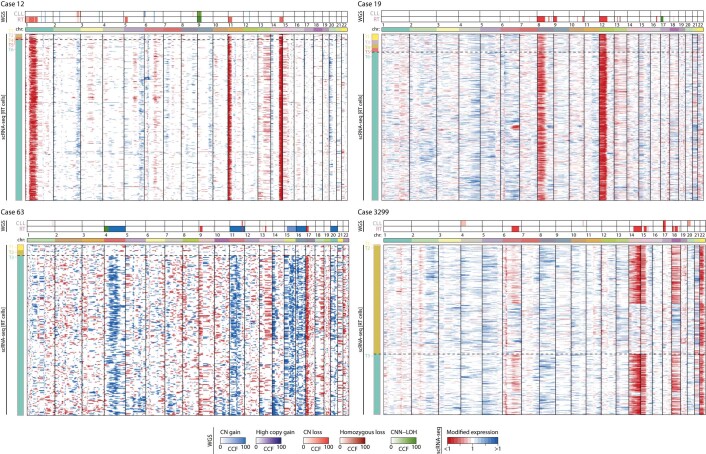
Extended Data Fig. 8. CNA profile of RT cells by scRNA-seq.
For each patient, the CNA profile of CLL and RT samples according to WGS is shown (top) together with the CNA profile of each individual RT cell based on scRNA-seq (bottom). For scRNA-seq, each row represents a RT cell and the horizontal dashed line separates the RT cells identified in the time points previous to the diagnosis of RT (that is, seed RT cells) from those present in the sample collected at time of diagnosis of RT. Note that CLL cells were used as reference for CNA analyses using scRNA-seq data.

