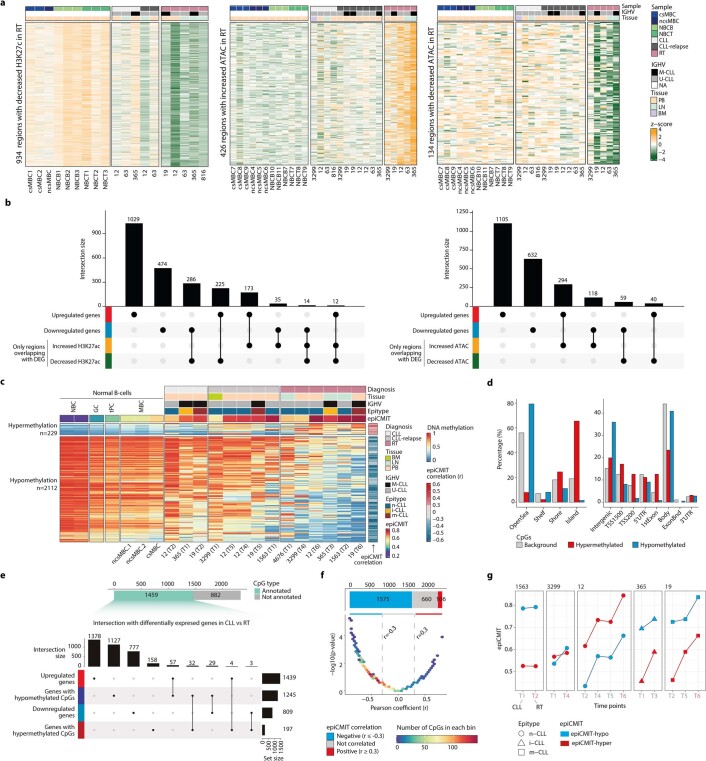
Extended Data Fig. 9. Epigenomic characterization of RT.
a. Heatmaps showing the regions with decreased H3K27ac, increased ATAC, and decreased ATAC levels, respectively, in RT. b. Overlap of differentially expressed genes by bulk RNA-seq with regions with increased or decreased H3K27ac and ATAC levels, respectively. c. Heat map showing differentially methylated CpGs (DMC) between CLL and RT. Normal B cells, CLL, CLL at relapse, and RT samples are shown separately with different biological information on top. The correlation of each CpG with the epiCMIT is depicted on the right. To note, the epiCMIT is associated with the gain and loss of methylation upon cell division, but its transformation to 0-1 scale (for interpretability purposes) makes it anticorrelated with hypomethylation, as the epiCMIT=max{epiCMIT-hyper, epiCMIT-hypo}, being the epiCMIT-hyper=hypermethylation, and the epiCMIT-hypo=1-hypomethyaltion at relevant CpGs, as originally reported49. d. Genomic enrichment over the background for hyper- and hypomethylated CpGs in CLL vs RT. e. DMC distribution based on their genetic annotation and their intersection with differentially expressed genes by bulk RNA-seq analyses. f. DMC distribution based on the correlation of each CpG with the epiCMIT and their p values. CpGs were piled up in color-coded bins based on the number of CpGs in each bin to avoid overplotting. g. epiCMIT evolution in longitudinal CLL and RT samples, with the epiCMIT-hyper and epiCMIT-hypo scores depicted separately (RT samples being the last time point labeled in rose). The epiCMIT score used to compare among samples is the greater of the two (hyper and hypo).

