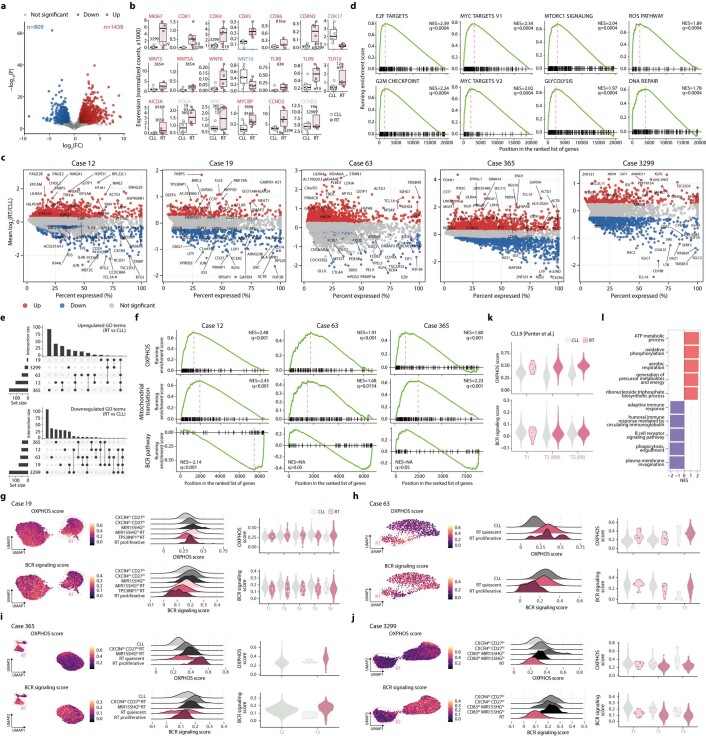
Extended Data Fig. 10. Transcriptomic characterization of RT.
a. Volcano plot of the differential expression analysis (RT vs CLL, bulk RNA-seq). b. Expression levels of selected genes in CLL and RT according to bulk RNA-seq. center line, median; box limits, upper/lower quartiles; whiskers, 1.5×interquartile range; points, individual samples. c. Differentially expressed genes (RT vs CLL) for each case by scRNA-seq. d. GSEA plots of selected hallmark gene sets according to bulk RNA-seq analyses. NES, normalized enrichment score. e. UpSet plots highlighting the intersections of the case-specific upregulated (top) and downregulated (bottom) GO terms in RT by scRNA-seq. f. GSEA plots for the terms oxidative phosphorylation (OXPHOS), mitochondrial translation, and BCR signaling pathway for cases 12, 63, and 365 based on scRNA-seq. g-j. scRNA-seq-derived UMAP visualization of tumor cells from all time points colored by OXPHOS and BCR signaling score (left). Ridge plots showing the same scores across clusters (middle). Violin plots displaying the same scores across time points, stratified by CLL and RT clusters (right). k. Violin plots displaying the OXPHOS and BCR signaling scores across time points, stratified by CLL and RT clusters, in case CLL9 from Penter et al43. l. GSEA between RT and CLL cells of patient CLL9 from Penter et al.43.

