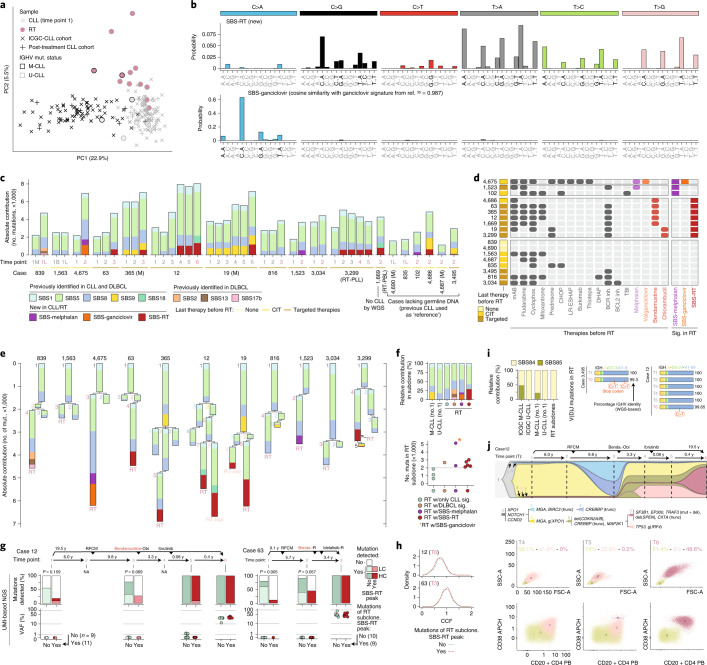
Fig. 2. Mutational processes in RT.
a, Principal component analysis (PCA) of the 96-mutational profile of CLL and RT. b, Signatures identified de novo in CLL/RT not reported in COSMIC. The main peaks of each signature are labeled in black. c, Contribution of mutational processes in CLL/RT. RT time points are marked in a rose color. B, peripheral blood; L, lymph node; M, bone marrow; (M), M-CLL. d, Therapies received before RT and presence/absence of SBS-melphalan, SBS-ganciclovir and SBS-RT at time of RT for each patient. mAB, monoclonal antibody; TBI, total body irradiation; Inh., inhibitor; Sig., signatures. e, Phylogenetic relationship of subclones and contribution of each mutational signature to their mutational profile. f, Relative contribution of mutational processes in CLL (no. 1) and RT subclones (top). Number of mutations (muts) in RT subclones (bottom). w/, with. g, Detection (top) and variant allele frequency (VAF) (bottom) of mutations assigned to the RT subclone during the disease course in patients 12 and 63 by high-coverage UMI-based NGS. Mutations are grouped according to the main peaks of SBS-RT. P values were obtained by Fisher’s test. LC, low confidence; HC, high confidence; NA, not available. h, Distribution of the CCF of the single-nucleotide variants (SNVs) assigned to the RT subclone based on WGS and stratified according to the main peaks of the SBS-RT. i, Relative contribution of mutational processes in regions of kataegis in CLL and RT (left). Two cases acquiring mutations in the immunoglobulin genes at time of RT (right). j, Clonal evolution along the disease course in patient 12 inferred from WGS. Abbreviations for treatment regimens are detailed in Extended Data Fig. 1a. Each subclone is depicted by a different color and number and its CCF is proportional to its height in each time point (vertical line). The phylogeny of the subclones with the main driver alterations is shown (top). Flow cytometry analysis for time points (T) 4, 5 and 6 (bottom). The size of the cells (forward scatter (FSC) versus side scatter (SSC), first row) and the expression levels of CD20 and CD38 (second row) differentiated CLL cells (yellowish) and the two larger size tumor populations (pale and dark rose color, respectively). Numbers along axes are divided by 1,000.

