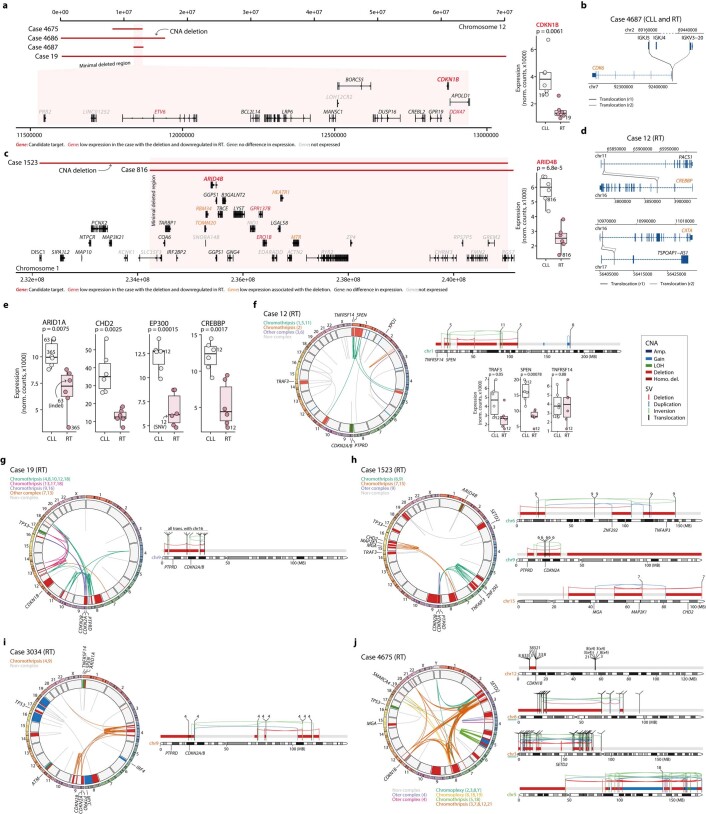
Extended Data Fig. 3. Complex genomic rearrangements affecting driver genes.
a. Deletions in chr12 identified in four cases with the minimal deleted region affecting CDKN1B, which expression in CLL and RT sample pairs is shown on the right. The case carrying the deletion at time of RT is labeled in the boxplot. b. Reciprocal translocation juxtaposing CDK6 next to IGKJ5 in patient 4687. c. Deletion in chr1 affecting two cases with the minimal deleted region targeting ARID4B. Its expression in CLL and RT sample pairs is shown in the boxplot on the right. d. Reciprocal translocations truncating CREBBP and CIITA in the RT sample of patient 12. e. Expression levels of known and novel RT-driver genes in CLL and RT paired samples. Cases carrying deletions/mutations at time of RT are labeled. f-j. Complex genomic rearrangements affecting driver genes in five selected RT samples. The circos plots show the SVs (inner links) and CNAs (middle circle) found in each sample. SVs are colored based on whether they are part of a complex event, while CNAs are painted according to their type. Chromosome-specific plots on the right show the main chromosomes affected by complex events targeting driver genes (annotated at the bottom). In these chromosome-specific plots, the color of both CNAs and SVs indicates their type. For patient 12 (f), the expression levels of three genes affected by simple (TRAF3) and complex (SPEN and TNFRS14) chromosomal alterations are shown. For patient 4675 (j), the partner of the translocations found in chr3 and chr8 are not specified for simplicity due to the high number of clustered structural events. All boxplots: center line, median; box limits, upper/lower quartiles; whiskers, 1.5×interquartile range; points, individual samples. All p values are from two-sided T tests.

