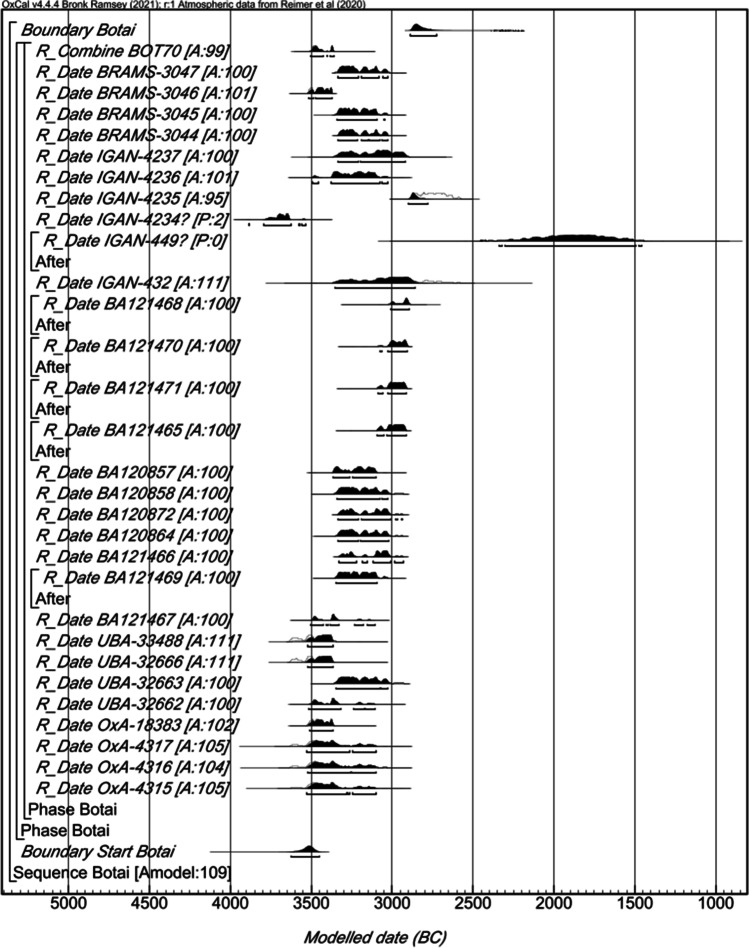
Fig. 4.
Probability distribution of CSRA dates from lipid residues diagnostic of horse products in pottery (BRAMS laboratory code) and published 14C dates for Botai. Each distribution represents the relative probability that an event occurs at a particular time. For each of the dates, two distributions have been plotted: one in outline, which is the result of simple radiocarbon calibration, and a solid one, based on the chronological model used. Distributions other than those relating to particular samples correspond to aspects of the model. The distribution followed by ‘?’ has been excluded from the model. The large square brackets down the left-hand side of the figure, along with the OxCal keywords, define the overall model exactly

