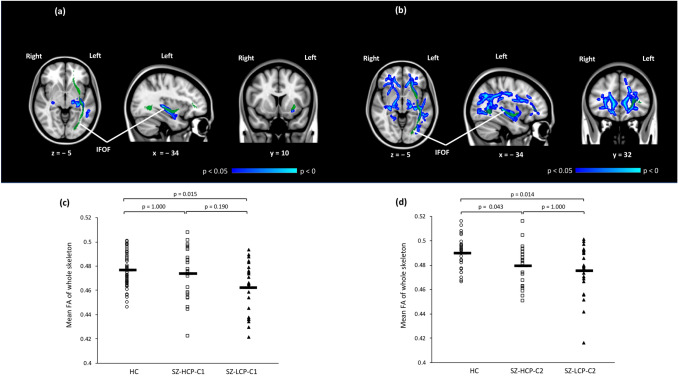
Fig. 1.
a Difference in fractional anisotropy (FA) values between the healthy controls (HC) and schizophrenia (SZ) groups in cohort (1). Blue to light blue voxels indicate regions where the FA values were significantly lower in the SZ group than in the HC group (p < 0.05). b Difference in FA values between the HC and SZ groups in cohort (2). Blue to light blue voxels indicate regions where the FA values were significantly lower in the SZ group than in the HC group (p < 0.05). c Differences in mean fractional anisotropy (FA) values of whole-brain white matter (WM) skeleton in healthy controls (HC) and in patients with schizophrenia with higher cognitive performance (SZ-HCP-C1) and lower cognitive performance (SZ-LCP-C1) in cohort (1). The circles represent mean FA values of the whole skeleton in the HC group; the squares represent mean FA values of the whole skeleton in the SZ-HCP-C1 group; and the triangles represent mean FA values of the whole skeleton in the SZ-LCP-C1 group. d Differences in mean FA values of whole-brain WM skeleton in the HC, SZ-HCP-C2, and SZ-LCP-C2 groups in cohort (2). The circles represent mean FA values of the whole skeleton in the HC group; the squares represent mean FA values of the whole skeleton in the SZ-HCP-C2 group; and the triangles represent mean FA values of the whole skeleton in the SZ-LCP-C2 group. FA fractional anisotropy, HC healthy controls, SZ schizophrenia, SZ-HCP-C1 patients with schizophrenia and higher cognitive performance in cohort (1), SZ-HCP-C2 patients with schizophrenia and higher cognitive performance in cohort (2), SZ-LCP-C1 patients with schizophrenia with lower cognitive performance in cohort (1), SZ-LCP-C2 patients with schizophrenia with lower cognitive performance in cohort (2)

