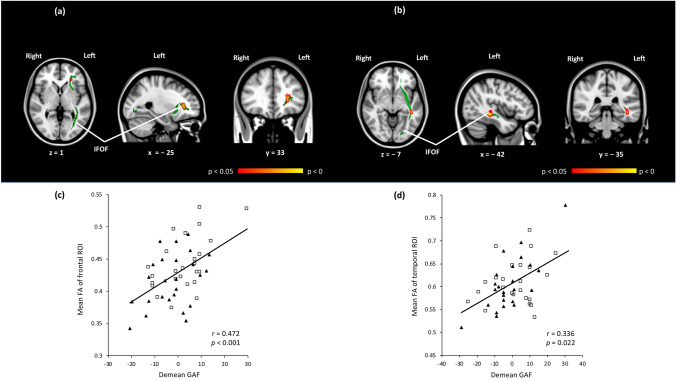
Fig. 2.
a Red-yellow voxels indicate a significant positive relation between the fractional anisotropy (FA) values in the left inferior fronto-occipital fasciculus (IFOF) and the demean Global Assessment of Functioning (GAF) scores in the schizophrenia (SZ) group in cohort (1). b Red-yellow voxels indicate a significant positive relation between the FA values in the left IFOF and the demean GAF scores in the SZ group in cohort (2). c Scatter plot showing the relation of the demean Global Assessment of Functioning (GAF) scores and mean fractional anisotropy (FA) values of the voxels that showed a statistically significant correlation in voxel-wise multiple regression analysis in a. The squares represent patients with schizophrenia and higher cognitive performance in cohort (1), and the triangles represent the group of patients with schizophrenia and lower cognitive performance in cohort (1). d Scatter plot showing the relation of the demean GAF scores and mean FA values of the voxels that reached a statistically significant correlation in voxel-wise multiple regression analysis in b. The squares represent patients with schizophrenia and higher cognitive performance in cohort (2), and the triangles represent patients with schizophrenia and lower cognitive performance in cohort (2). FA fractional anisotropy, GAF global assessment of functioning, IFOF inferior front-occipital fascicles, SZ schizophrenia, ROI region of interest

