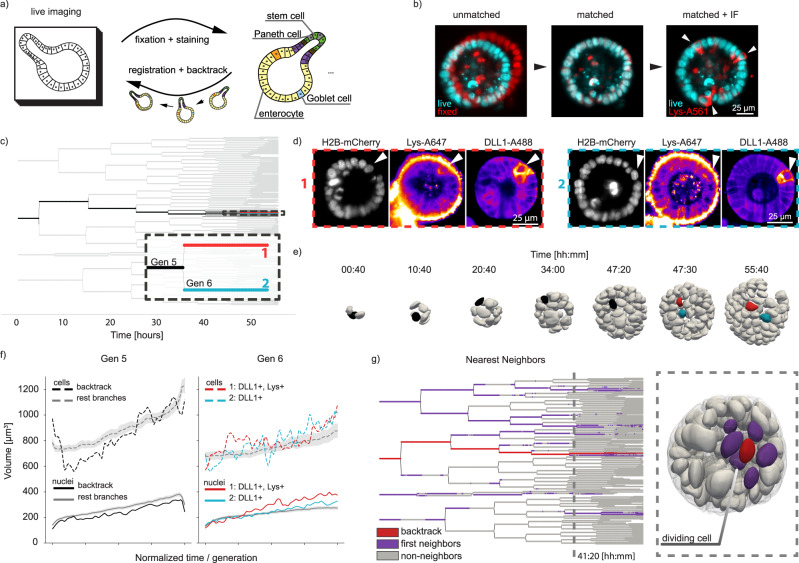
Fig. 4. Fixation and backtracking after live-imaging.
a Fixation and backtracking strategy for light-sheet imaging of organoid growth (shown recording 007). b After fixation a registration step may be needed to overlap the fixed nuclei with the nuclei as shown in the last timepoint of the timelapse. Left: midplane of raw data from last time-point H2B-mCherry recording (cyan) against same plane after fixation (red). Center: registration maps the fixed volume into the last time-point volume. Although overlap is not perfect, it is sufficient to maps each nucleus back. Right: After registration additional information from immunolabelling can be overlayed onto last time-point of the live recording, and so cells of interest can be backtracked. A total of four different experiments were performed with similar results. c Lineage tree depicting the backtracking of two sister cells. d After fixation, staining for DLL1 and Lysozyme shows two cells expressing these markers. Backtracking of them is shown in (a). e Nuclei volume distribution for the backtracked cells against all other cells per generation. f Evaluation of nuclei and cell volumes for the backtracked cells against all other cells during generations 5 and 6, as depicted in (c). For all other cells, the midline corresponds to the mean, whereas the gray region is the standard distribution. g Nearest neighbor evaluation of the backtracked Lys+ cell (red). All nearest neighbors are depicting in magenta, with all remaining cells in gray. Dashed line on the lineage tree is presented as corresponding segmented meshes on the right. A dividing cell can be recognized by the interkinetic movement of its nucleus further apically. Source data are provided as a Source Data file.

