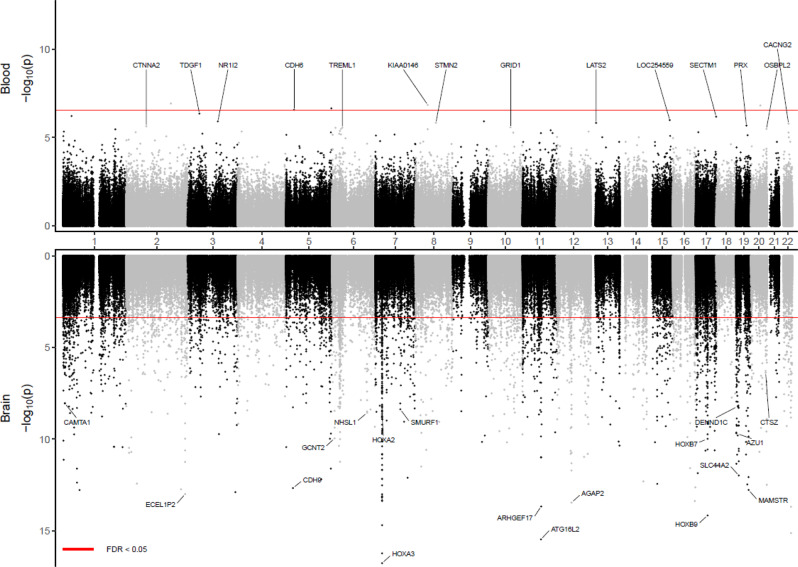
Fig. 1. Miami plot for epigenome-wide meta-analysis of blood DNA methylation in ADNI and AIBL datasets.
The X-axis shows chromosome numbers. The Y-axis shows –log10(P-value) of methylation to AD diagnosis association in the blood (above X-axis) or methylation to AD neuropathology (Braak stage) association in the brain (below X-axis). The genes corresponding to the top 20 most significant CpGs in blood or brain samples meta-analyses are highlighted. The P-values for brain sample meta-analysis were obtained from Zhang et al. (2020) (PMID: 33257653). The red line indicates a significance threshold of 5% False Discovery Rate for multiple comparison correction. All statistical tests are two-sided.

