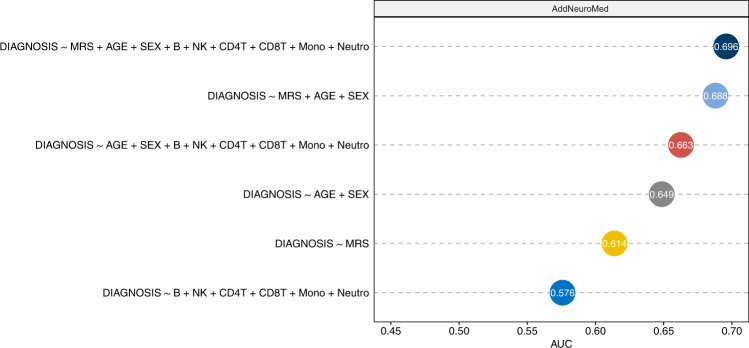
Fig. 3. Performance of different logistic regression models for predicting AD diagnosis in out-of-sample validation.
The training samples included 135 AD cases and 356 control samples from the AIBL dataset, and the testing samples included 83 AD cases and 88 control samples from the AddNeuroMed dataset. Among the 97 prioritized CpGs in cross-tissue analysis, 91 CpGs are also available in the testing dataset (i.e., AddNeuroMed). Methylation risk score (MRS) was computed as the sum of methylation beta values for these 91 CpGs weighted by their estimated effect sizes in the AIBL dataset. Abbreviation: AUC Area Under ROC curve, MRS methylation risk score.

